Overview
Eco Driving scores each vehicle and driver from 0 to 100 on how economically and safely they drive. Use it to find drivers who need coaching, compare fleets, and track fuel waste.
The module has four parts:
| Part | What it does |
|---|---|
| Fleet / Drivers views | Score table per vehicle or per driver |
| Detail panel | Sub-score breakdown for the selected row |
| Group Manager | Eco groups, scoring rules, edit history |
| Reports & AI insights | Eco report, AI-generated coaching summary |
Main dashboard
The dashboard shows a score table for the selected period, with a Totals row for the whole fleet on top.
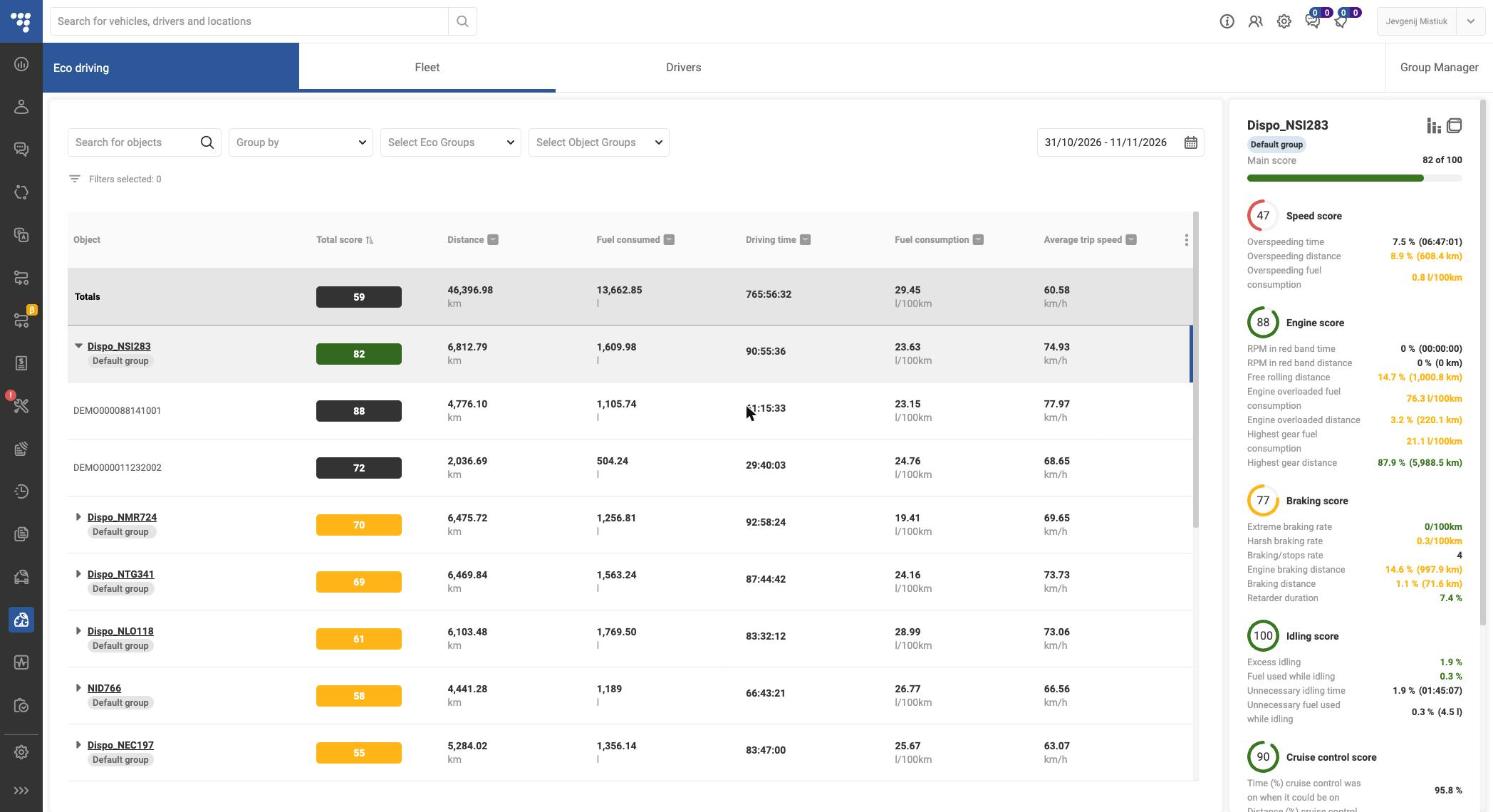
Fleet tab = one row per vehicle; expand a vehicle (▸) to see the drivers who drove it. Drivers tab = one row per driver; expand to see their eco groups and vehicles.
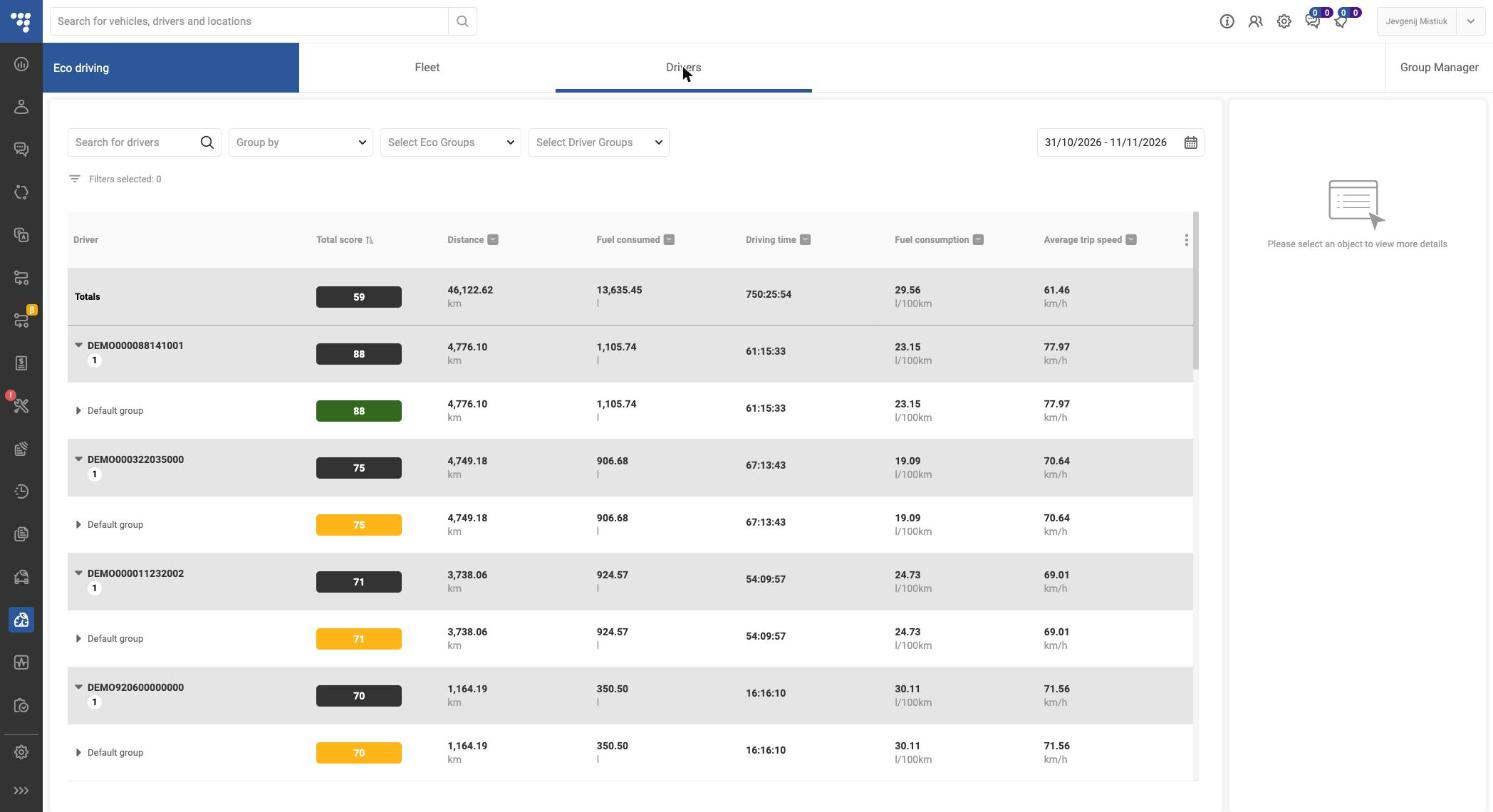
Filters and controls
| Control | What it does |
|---|---|
| Search for objects / drivers | Find a vehicle or driver by name |
| Group by | Groups data according selection (No group, Eco group, or Object/Driver group) |
| Select Eco Groups | Show only chosen eco groups |
| Select Object Groups / Driver Groups | Show only chosen objects groups |
| Date range | Period for all scores and totals |
| Column header ▾ | Sort or filter by that column |
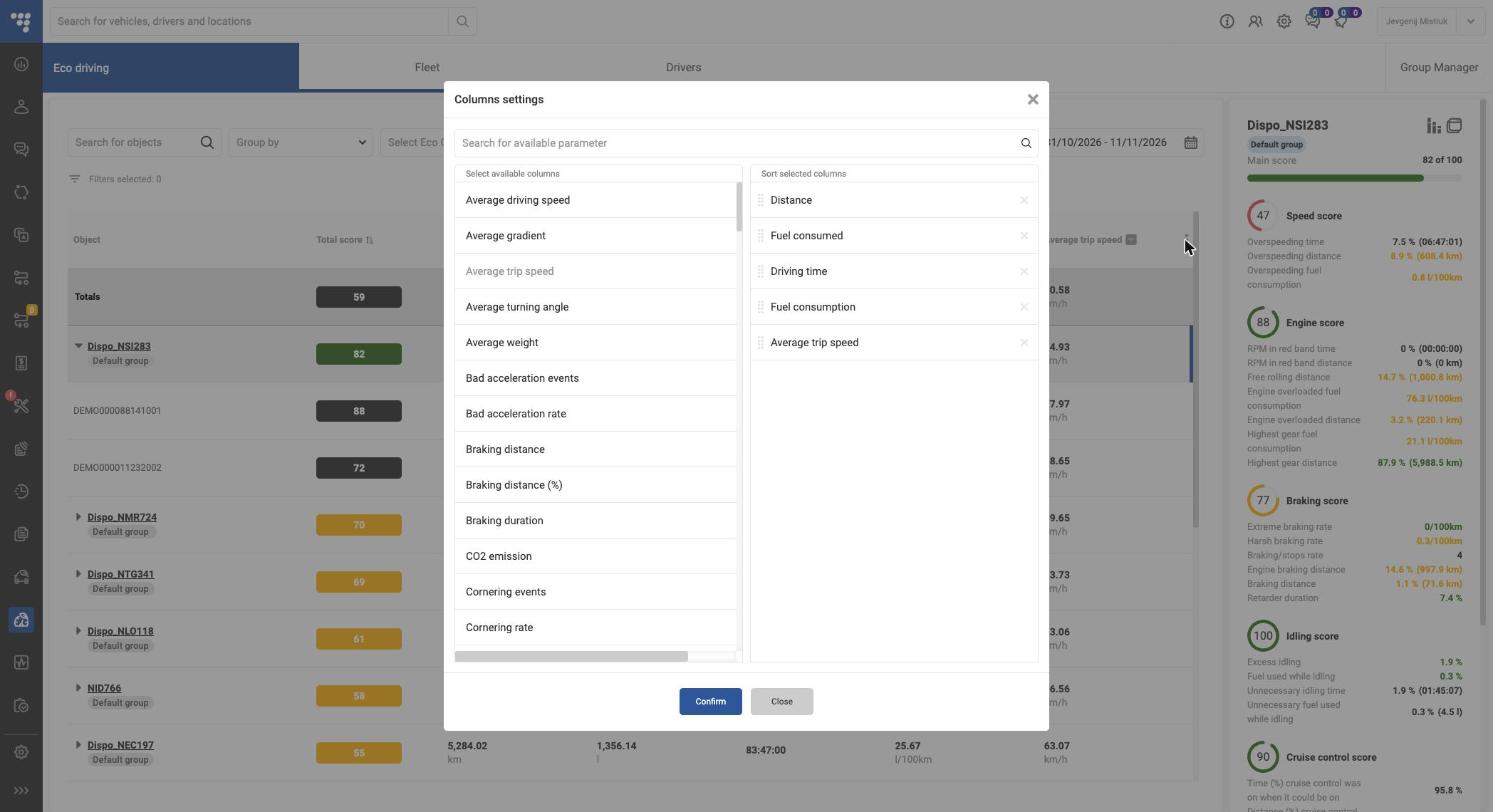
| ⋮ (end of header) | Columns settings: add, remove and reorder columns (e.g. CO2 emission, Braking distance, Cornering rate); click Confirm |
Score colours
- Green — good (above the upper threshold, default 80)
- Yellow — needs attention (between thresholds)
- Red — poor (below the lower threshold)
Detail panel
Click any row to open the right-hand panel. It shows the Main score and each sub-score (Speed, Engine, Braking, Acceleration, Idling, Cruise control) with the metrics behind it, e.g. Overspeeding distance 8.9 % (608.4 km). Metric values are coloured the same way as scores.
Default columns: Total score, Distance (km), Fuel consumed (l), Driving time, Fuel consumption (l/100km), Average trip speed (km/h).
Groups management
Eco groups let you score different vehicle types with different rules (e.g. trucks vs vans). Every vehicle belongs to exactly one eco group; new vehicles go to Default group.
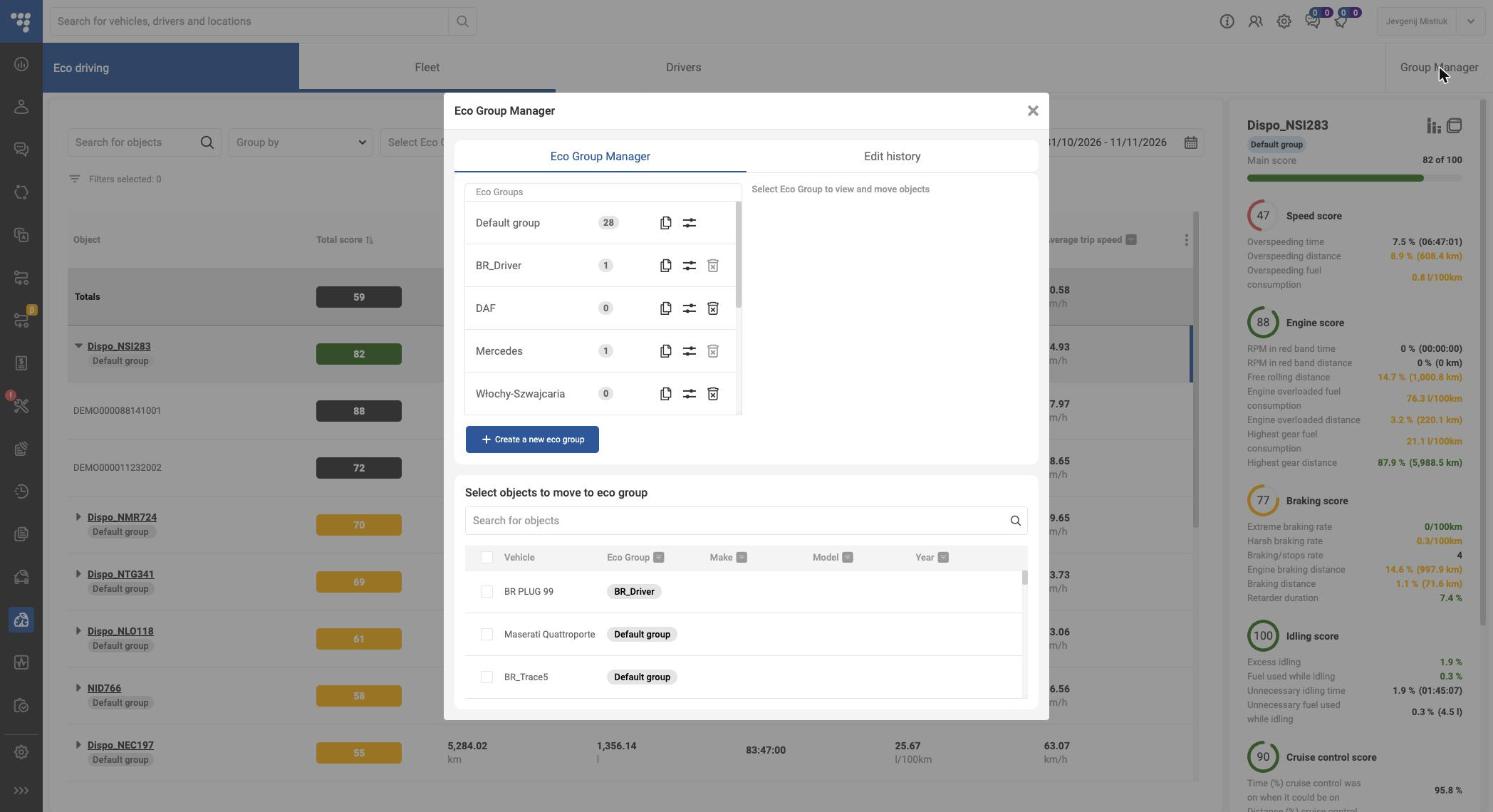
Open it with Group Manager (top-right). The window has two tabs: Eco Group Manager and Edit history.
Group actions
| Icon / button | Action |
|---|---|
| Click group name | Shows its vehicles in Objects in Eco Group |
| Copy icon | Duplicates the group with its scoring settings |
| Sliders icon | Opens Configure scores for the group (see Scoring) |
| Bin icon | Deletes the group (only when it has no vehicles; Default group can’t be deleted) |
| + Create a new eco group | Adds a row — type a name, confirm; × cancels |
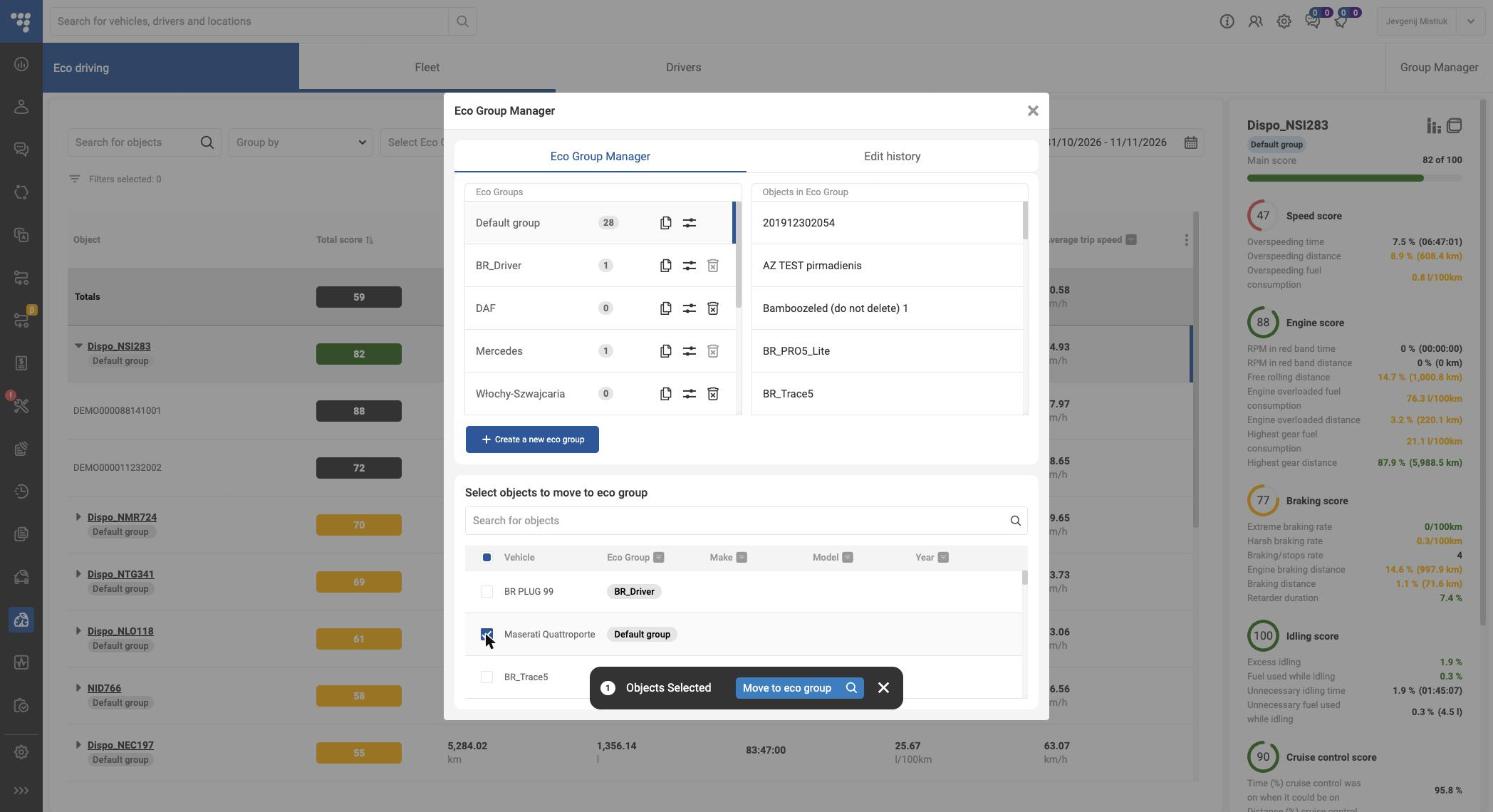
Move vehicles to a group
- In Select objects to move to eco group, search or filter by Eco Group, Make, Model, Year.
- Tick the vehicles.
- Click Move to eco group in the bar that appears and pick the target group.
- To cancel, click × on the selection bar.
Edit history
Lists every change to eco groups: Changed by, Date & time, Change, Description, Eco Group. Use it to audit who changed scoring rules.
Scoring
The Total score is a weighted average of six sub-scores. Each sub-score is a weighted average of its metrics. Weights and colour thresholds are set per eco group.
Open: Group Manager → sliders icon next to a group → Configure scores for <group>. Pick a score on the left, edit on the right, then Save. Set to default restores factory values.
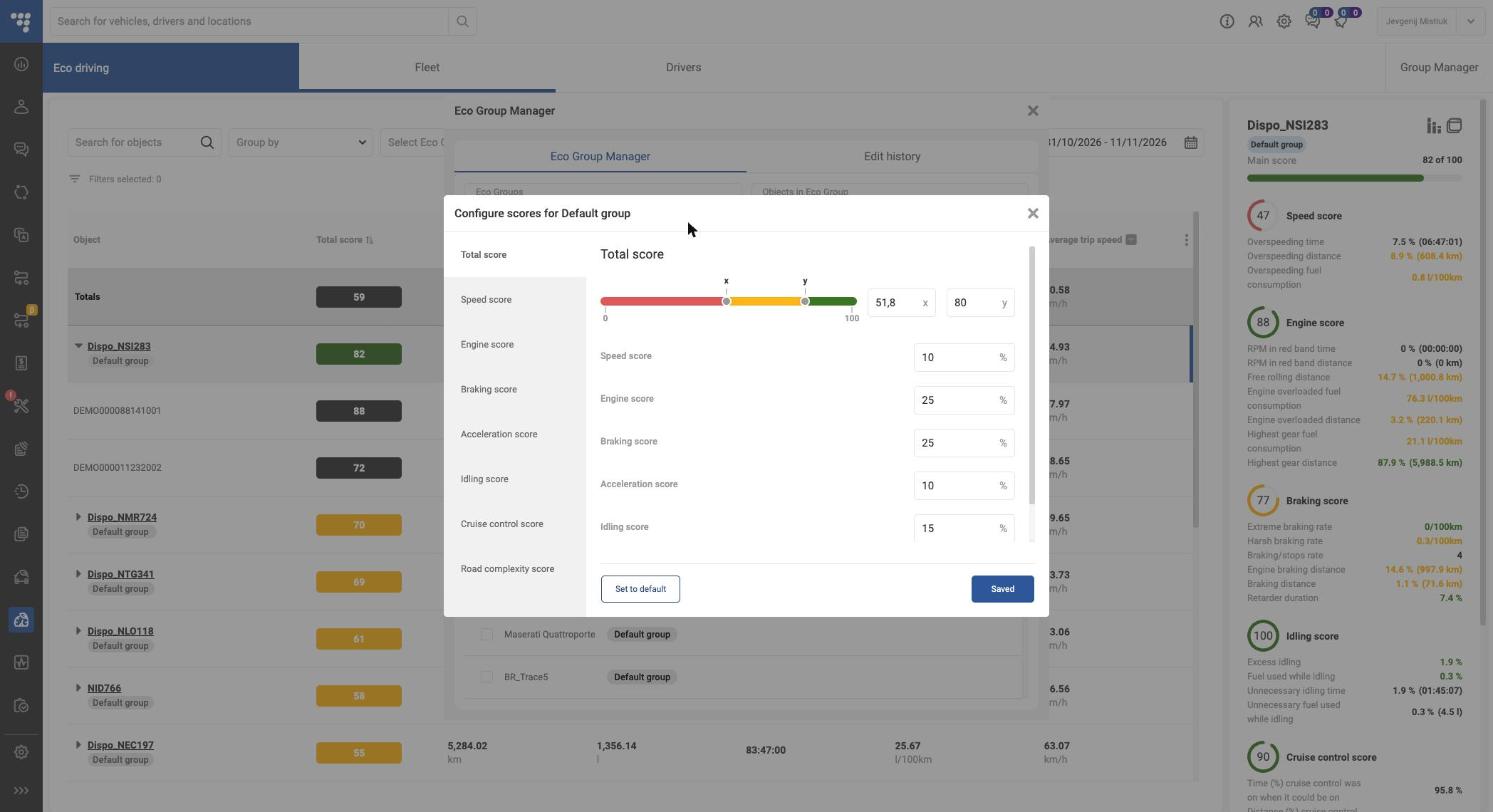
Thresholds (x / y)
Each score has a colour bar with two handles: x (red/yellow border) and y (yellow/green border). Drag them or type the values. For metrics where lower is better (e.g. overspeeding %), the bar is reversed: green on the left.
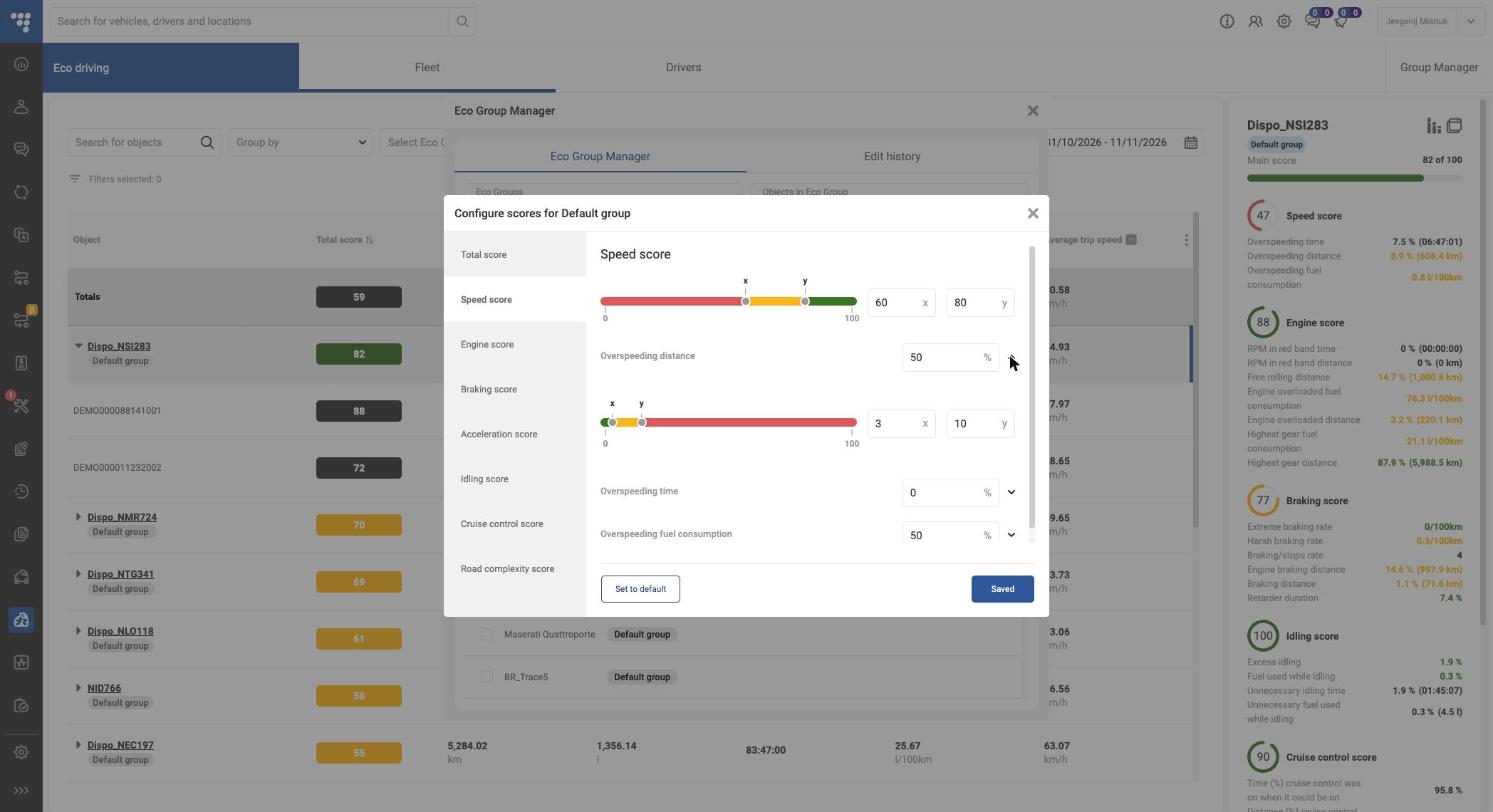
Default weights (Default group)
| Score | Weight in Total | Metrics (weight inside the score) |
|---|---|---|
| Speed | 10 % | Overspeeding distance 50 %, Overspeeding fuel consumption 50 %, Overspeeding time 0 % |
| Engine | 25 % | Free rolling distance 30 %, Engine overloaded distance 20 %, Highest gear distance 10 %, Engine overloaded fuel consumption 20 %, Highest gear fuel consumption 20 %, RPM in red band distance/time 0 % |
| Braking | 25 % | Engine braking distance 20 %, Harsh braking rate 20 %, Extreme braking rate 20 %, Braking distance 30 %, Retarder duration 10 %, Braking/stops rate 0 % |
| Acceleration | 10 % | Harsh acceleration rate 100 %, Cornering acceleration rate 0 % |
| Idling | 15 % | Excess idling 80 %, Fuel used while idling 20 % |
| Cruise control | 15 % | Distance with cruise control when possible 70 %, Cruise control fuel consumption 30 % |
Weights in each list must add up to 100 %. Set a metric to 0 % to ignore it.
Road complexity score
Not part of the Total. It shows how hard the route was (0–100, higher = harder) from Average weight, Average gradient, Average turning angle and Average driving speed (25 % each). Use it to compare drivers fairly.
Reports
The Eco-Drive report is a full, printable breakdown for one vehicle or driver over the selected period.
Open: select a row → click the View Report icon (top-right of the detail panel). The report opens in a new browser tab.
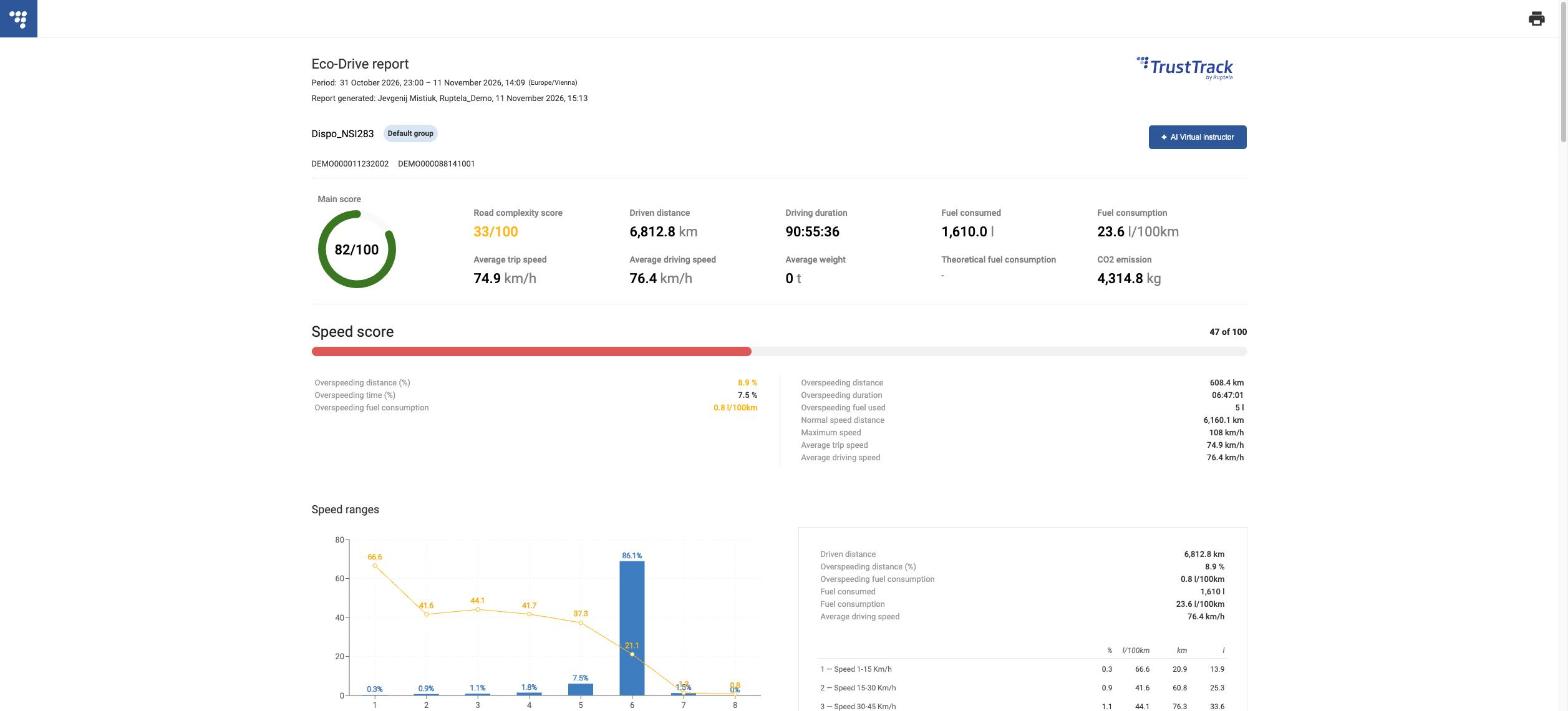
What the report contains
| Block | Content |
|---|---|
| Header | Period with time zone, who generated it and when, object, eco group, drivers |
| Summary | Main score ring, Road complexity, distance, duration, fuel consumed, fuel consumption, average speeds, average weight, theoretical fuel consumption, CO2 emission |
| Speed score | Overspeeding metrics + Speed ranges chart (share of distance and l/100km per speed band, 1–250 km/h) |
| Engine score | RPM red band, free rolling, overload, highest gear, RPM ranges 1–4 + Engine percent load ranges and RPM ranges charts |
| Braking score | Braking metrics + Braking ranges chart |
| Idling, Cruise control | Metrics behind each score |
| Acceleration score | Harsh acceleration/cornering + Acceleration pedal ranges chart |
| Road complexity | Weight, gradient, turning angle, speed |
Left column = % / rate values (coloured by threshold); right column = absolute values (km, l, time).
Print / PDF: click the printer icon (top-right) and choose Save as PDF.
AI insights (AI Virtual instructor)
The AI Virtual instructor turns the report numbers into a plain-language coaching summary for the driver.
Open: in the Eco-Drive report, click ✦ AI Virtual instructor (top-right). Generation takes about 10 seconds. Three cards appear above the summary:
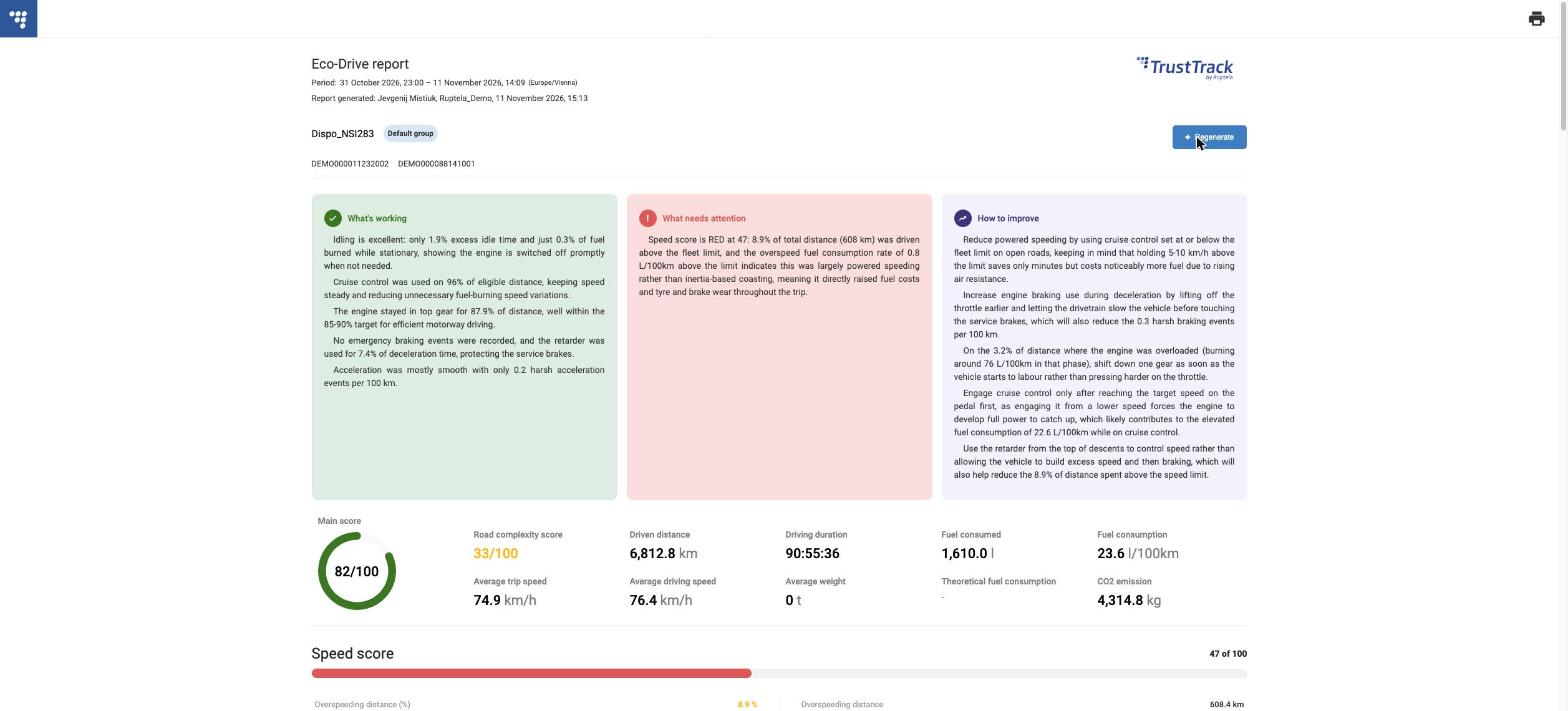
| Card | Shows | Example (Dispo_NSI283) |
|---|---|---|
| What’s working (green) | Strengths backed by numbers | Only 1.9 % excess idling; cruise control on 96 % of eligible distance |
| What needs attention (red) | The weakest score and why | Speed score 47: 8.9 % of distance (608 km) above the limit |
| How to improve (purple) | Concrete driving tips | Set cruise control at or below the limit; use engine braking earlier |
Click ✦ Regenerate to create a new version. The cards are included when you print the report, so you can hand them to the driver.
AI text is advice only; check it against the numbers below before acting on it.
Eco-driving parameters:
| Header name | Name | Description |
|---|---|---|
| Driver | Name of the driver. | |
| Vehicle | Name of the vehicle. | |
| Main | Distance | Driven distance. |
| Main | Driving time | Engine-on duration. |
| Main | Fuel consumed | Total amount of fuel consumed. |
| Main | Fuel consumption | Fuel consumed per 100 km. |
| Main | Average weight | Average weight for the selected period. |
| Main | Average turning angle | Average turning angle per kilometer for the selected period. |
| Main | Average gradient | Average turning gradient per kilometer for the selected period. |
| Main | Theoretical fuel consumption | Shows the theoretical fuel consumption of the vehicle. |
| Main | Total score | |
| Speed | Average Trip speed | Average speed. |
| Speed | Average driving speed | Average speed without idling time. |
| Speed | Maximum speed | Maximum speed. |
| Speed | Overspeeding time | Duration when the vehicle was overspeeding (speed limit is configurable). |
| Speed | Overspeeding time (%) | The percentage of driving time when the vehicle was overspeeding. |
| Speed | Overspeeding distance | Distance while the vehicle was overspeeding (speed limit is configurable). |
| Speed | Overspeeding distance (%) | The percentage of distance while the vehicle was overspeeding. |
| Speed | Overspeeding fuel used | Fuel used while the vehicle was overspeeding (speed limit is configurable). |
| Speed | Overspeeding fuel consumption | Fuel consumption while the vehicle was overspeeding. |
| Speed | Normal speed distance | Distance when the vehicle’s speed was below the speed limit (speed limit is configurable). |
| Speed | Speed score | |
| Engine | RPM in red band time | Duration when the RPM value was out of the acceptable range (RPM range is configurable). |
| Engine | RPM in red band time (%) | The percentage of driving time when the vehicle was operated in the RPM red band. |
| Engine | Maximum RPM | Maximum RPM. |
| Engine | RPM in green band distance | Distance when the RPM value was in the acceptable range (RPM range is configurable). |
| Engine | RPM in red band distance | Distance when the RPM value was out of the acceptable range (RPM range is configurable). |
| Engine | RPM in red band distance (%) | The percentage of distance when the RPM value was out of the acceptable range. |
| Engine | RPM range 1 distance | Distance while the vehicle’s engine was running in RPM range 1 (RPM range is configurable). |
| Engine | RPM range 1 fuel used | Fuel used while the vehicle’s engine was running in RPM range 1 (RPM range is configurable). |
| Engine | RPM range 2 distance | Distance while the vehicle’s engine was running in RPM range 2 (RPM range is configurable). |
| Engine | RPM range 2 fuel used | Fuel used while the vehicle’s engine was running in RPM range 2 (RPM range is configurable). |
| Engine | RPM range 3 distance | Distance while the vehicle’s engine was running in RPM range 3 (RPM range is configurable). |
| Engine | RPM range 3 fuel used | Fuel used while the vehicle’s engine was running in RPM range 3 (RPM range is configurable). |
| Engine | RPM range 4 distance | Distance while the vehicle’s engine was running in RPM range 4 (RPM range is configurable). |
| Engine | RPM range 4 fuel used | Fuel used while the vehicle’s engine was running in RPM range 4 (RPM range is configurable). |
| Engine | RPM range 1 fuel consumption | Fuel consumption while the vehicle’s engine was running in RPM range 1. |
| Engine | RPM range 2 fuel consumption | Fuel consumption while the vehicle’s engine was running in RPM range 2. |
| Engine | RPM range 3 fuel consumption | Fuel consumption while the vehicle’s engine was running in RPM range 3. |
| Engine | RPM range 4 fuel consumption | Fuel consumption while the vehicle’s engine was running in RPM range 4. |
| Engine | RPM range 1 distance (%) | The percentage of distance while the vehicle’s engine was running in RPM range 1. |
| Engine | RPM range 2 distance (%) | The percentage of distance while the vehicle’s engine was running in RPM range 2. |
| Engine | RPM range 3 distance (%) | The percentage of distance while the vehicle’s engine was running in RPM range 3. |
| Engine | RPM range 4 distance (%) | The percentage of distance while the vehicle’s engine was running in RPM range 4. |
| Engine | Free rolling distance | Distance while the vehicle was free rolling (engine on, accelerator pedal off (0%), RPM in the 450–650 range (configurable)). |
| Engine | Engine overloaded distance (%) | The percentage of distance when the engine percent load parameter was above the threshold. |
| Engine | Engine overloaded distance | Distance when the engine percent load parameter was above the threshold (configurable). |
| Engine | Engine overloaded fuel used | Fuel used when the engine percent load parameter was above the threshold (configurable). |
| Engine | Highest gear distance | Distance when the vehicle’s speed exceeded the configured “highest gear speed”. |
| Engine | Highest gear fuel used | Fuel used when the vehicle’s speed exceeded the configured “highest gear speed”. |
| Engine | Free rolling distance (%) | The percentage of distance while the vehicle was free rolling. |
| Engine | Highest gear distance (%) | The percentage of distance when the vehicle’s speed exceeded the configured “highest gear speed”. |
| Engine | Engine overloaded fuel consumption | Fuel consumption when the engine percent load parameter was above the threshold. |
| Engine | Highest gear fuel consumption | Fuel consumption when the vehicle’s speed exceeded the configured “highest gear speed”. |
| Engine | Free rolling without cruise control distance | Distance when cruise control is OFF, the engine is ON, throttle position is 0, and RPM is in the free rolling RPM range (configurable). |
| Engine | Free rolling without cruise control fuel used | Fuel used when cruise control is OFF, the engine is ON, throttle position is 0, RPM is in the free rolling RPM range (configurable), and CAN wheel-based speed is > 0 km/h. |
| Engine | Free rolling without cruise control fuel consumption | Fuel consumption when cruise control is OFF, the engine is ON, throttle position is 0, RPM is in the free rolling RPM range (configurable), and CAN wheel-based speed is > 0 km/h. |
| Engine | Free rolling without cruise control distance (%) of free rolling distance | The percentage of free rolling distance when cruise control is OFF, the engine is ON, throttle position is 0, and RPM is in the free rolling RPM range (configurable). |
| Engine | Engine score | |
| Braking | Extreme braking events | Extreme braking events (registered when braking acceleration exceeds the configured limit). |
| Braking | Extreme braking rate | The average number of extreme braking events per 100 km. |
| Braking | Harsh braking events | Harsh braking events (registered when braking acceleration exceeds the configured limit). |
| Braking | Harsh braking rate | The average number of harsh braking events per 100 km. |
| Braking | Normal braking events | Normal braking events. |
| Braking | Normal braking rate | The average number of normal braking events per 100 km. |
| Braking | Maximum braking value | Maximum braking value. |
| Braking | Braking distance | Distance traveled while the brake pedal was pressed. |
| Braking | Braking duration | Time period when the brake pedal was pressed and vehicle speed was not 0. |
| Braking | Engine braking distance | Distance while speed was above the configurable threshold, fuel rate was below the configurable threshold, and RPM was above the configurable threshold. |
| Braking | Retarder duration | Time period when the retarder torque mode was not 0. |
| Braking | Stops | Number of vehicle stops. |
| Braking | Stops rate | Number of vehicle stops per 100 km. |
| Braking | Braking/stops rate | Normal braking events and stops rate. |
| Braking | Braking distance (%) | The percentage of distance traveled while the brake pedal was pressed. |
| Braking | Engine braking distance (%) | The percentage of distance while speed was above the configurable threshold, fuel rate was below the configurable threshold, and RPM was above the configurable threshold. |
| Braking | Retarder duration (%) | Percentage of driving time when the retarder torque mode was not 0. |
| Braking | Retarder distance | Distance when retarder torque was above zero. |
| Braking | Retarder without cruise control distance | Distance when retarder torque was above zero and cruise control was OFF. |
| Braking | Retarder without cruise control distance (%) | Percentage of retarder without cruise control distance. |
| Braking | Retarder distance (%) | Percentage of distance when retarder torque was above zero. |
| Braking | Parking brake abuse | Notification of the following event: CAN wheel-based speed ≥ parking brake abuse limit and parking brake switch state = 1. |
| Braking | Parking brake abuse rate | Parking brake abuse rate. |
| Braking | Braking score | |
| Acceleration events | Harsh acceleration events | Harsh acceleration events (registered when braking acceleration exceeds the configured limit). |
| Acceleration events | Harsh acceleration rate | The average number of harsh acceleration events per 100 km is shown in brackets. |
| Acceleration events | Good acceleration events | This is counted as a tolerable acceleration event. |
| Acceleration events | Good acceleration rate | The average number of good acceleration events per 100 km is shown in brackets. |
| Acceleration events | Bad acceleration events | Count of intolerable acceleration events. |
| Acceleration events | Bad Acceleration rate | The average number of bad acceleration events per 100 km is shown in brackets. |
| Acceleration events | Maximum acceleration value | Maximum acceleration value. |
| Acceleration events | Acceleration score | |
| Cornering | Cornering events | Number of cornering events when the cornering acceleration exceeds the configured limit. |
| Cornering | Cornering rate | Number of cornering events per 100 km. |
| Cornering | Maximum cornering value | Maximum cornering value. |
| Idling | Idling | Idling time (when the engine is on for a certain duration (configurable) and the vehicle’s speed is lower than the threshold (configurable)). |
| Idling | Excess idling (%) | Shows the percentage of driving time when the vehicle was idling. |
| Idling | Fuel used while idling | Fuel used while idling. |
| Idling | Fuel used while idling (%) | Percentage of fuel that was used while idling. |
| Idling | Idling score | |
| Cruise control | Time (%) cruise control was on when it could be on | Shows the percentage of time cruise control was used when it could be used (if cruise control was used all the time it could be used, the parameter would be 100%). The speed that defines when cruise control can be used is configurable. |
| Cruise control | Time cruise control could be on | Time when cruise control could be on, i.e., speed is above the threshold (configurable) for longer than 60 seconds. |
| Cruise control | Time cruise control was on when it could be on | Time when cruise control was on and speed was above the threshold (configurable) for longer than 60 seconds. |
| Cruise control | Distance cruise control could be on | Distance when cruise control could be on, i.e., speed is above the threshold (configurable) for longer than 60 seconds. |
| Cruise control | Distance cruise control was on when it could be on | Distance when cruise control was on and speed was above the threshold (configurable) for longer than 60 seconds. |
| Cruise control | Cruise control distance | Distance when cruise control was on. |
| Cruise control | Cruise control fuel used | Fuel used when cruise control was on. |
| Cruise control | Distance (%) cruise control was on when it could be on | Shows the percentage of distance cruise control was used when it could be used. |
| Cruise control | Cruise control fuel consumption | Fuel consumption when cruise control was on. |
| Cruise control | Cruise control distance (%) | Percentage of distance when cruise control was ON. |
| Cruise control | Free rolling with cruise control distance | Distance when cruise control is ON, the engine is ON, throttle position is 0, and RPM is in the free rolling RPM range (configurable). |
| Cruise control | Free rolling with cruise control fuel used | Fuel used when cruise control is ON, the engine is ON, throttle position is 0, RPM is in the free rolling RPM range (configurable), and CAN wheel-based speed is > 0 km/h. |
| Cruise control | Free rolling with cruise control fuel consumption | Fuel consumption when cruise control is ON, the engine is ON, throttle position is 0, RPM is in the free rolling RPM range (configurable), and CAN wheel-based speed is > 0 km/h. |
| Cruise control | Free rolling with cruise control distance (%) of free rolling distance | Percentage of free rolling distance when cruise control is ON, the engine is ON, throttle position is 0, and RPM is in the free rolling RPM range (configurable). |
| Cruise control | Cruise control duration | Time when cruise control was on. |
| Cruise control | Cruise control duration (%) | Percentage of time when cruise control was on. |
| Cruise control | Cruise control with accelerator fuel used | Fuel used when the engine is ON, cruise control is ON, and the throttle position sensor is above the configured limit. |
| Cruise control | Cruise control with accelerator distance | Distance when the engine is ON, cruise control is ON, and the throttle position sensor is above the configured limit. |
| Cruise control | Cruise control with accelerator time | Time when the engine is ON, cruise control is ON, and the throttle position sensor is above the configured limit. |
| Cruise control | Cruise control with accelerator fuel consumption | Fuel consumption when the engine is ON, cruise control is ON, and the throttle position sensor is above the configured limit. |
| Cruise control | Cruise control with accelerator distance (%) of cruise control distance | Percentage of cruise control distance when the engine is ON, cruise control is ON, and the throttle position sensor is above the configured limit. |
| Cruise control | Cruise control with accelerator time(%) of cruise control time | Percentage of cruise control time when the engine is ON, cruise control is ON, and the throttle position sensor is above the configured limit. |
| Cruise control | Cruise control score | |
| PTO | PTO time | Duration when the vehicle worked on PTO. |
| PTO | PTO time (%) | The percentage of driving time when the vehicle worked on PTO. |
| PTO | PTO distance | Distance while the vehicle worked on PTO. |
| PTO | PTO distance (%) | The percentage of distance while the vehicle worked on PTO. |
| PTO | PTO fuel used | Fuel used while the vehicle worked on PTO. |
| PTO | PTO fuel fuel used (%) | Percentage of fuel that was used while working on PTO. |
| PTO | Unnecessary Idling time | Duration of unnecessary idling. |
| PTO | Unnecessary Idling time (%) | Percentage of driving time when the vehicle was idling unnecessarily. |
| PTO | Unnecessary fuel used while idling | Fuel used while idling unnecessarily. |
| PTO | Unnecessary fuel used while idling (%) | Percentage of fuel that was used while idling unnecessarily. |
| Road Complexity score | Road Complexity score | This is a completely separate score that is not included in the main score. |
| CO2 emission | CO2 emission | Calculated by fuel type: Diesel 2,68 kg/l, Petrol 2,31 kg/l, LPG 2,31 kg/l. |