The Eco-drive menu is an overview of economic, proper, and safe driving styles of both drivers and vehicles which are rated by scores and displayed on the page.
To access the Eco-Drive page, click on the according icon on the left navigation panel as shown below:
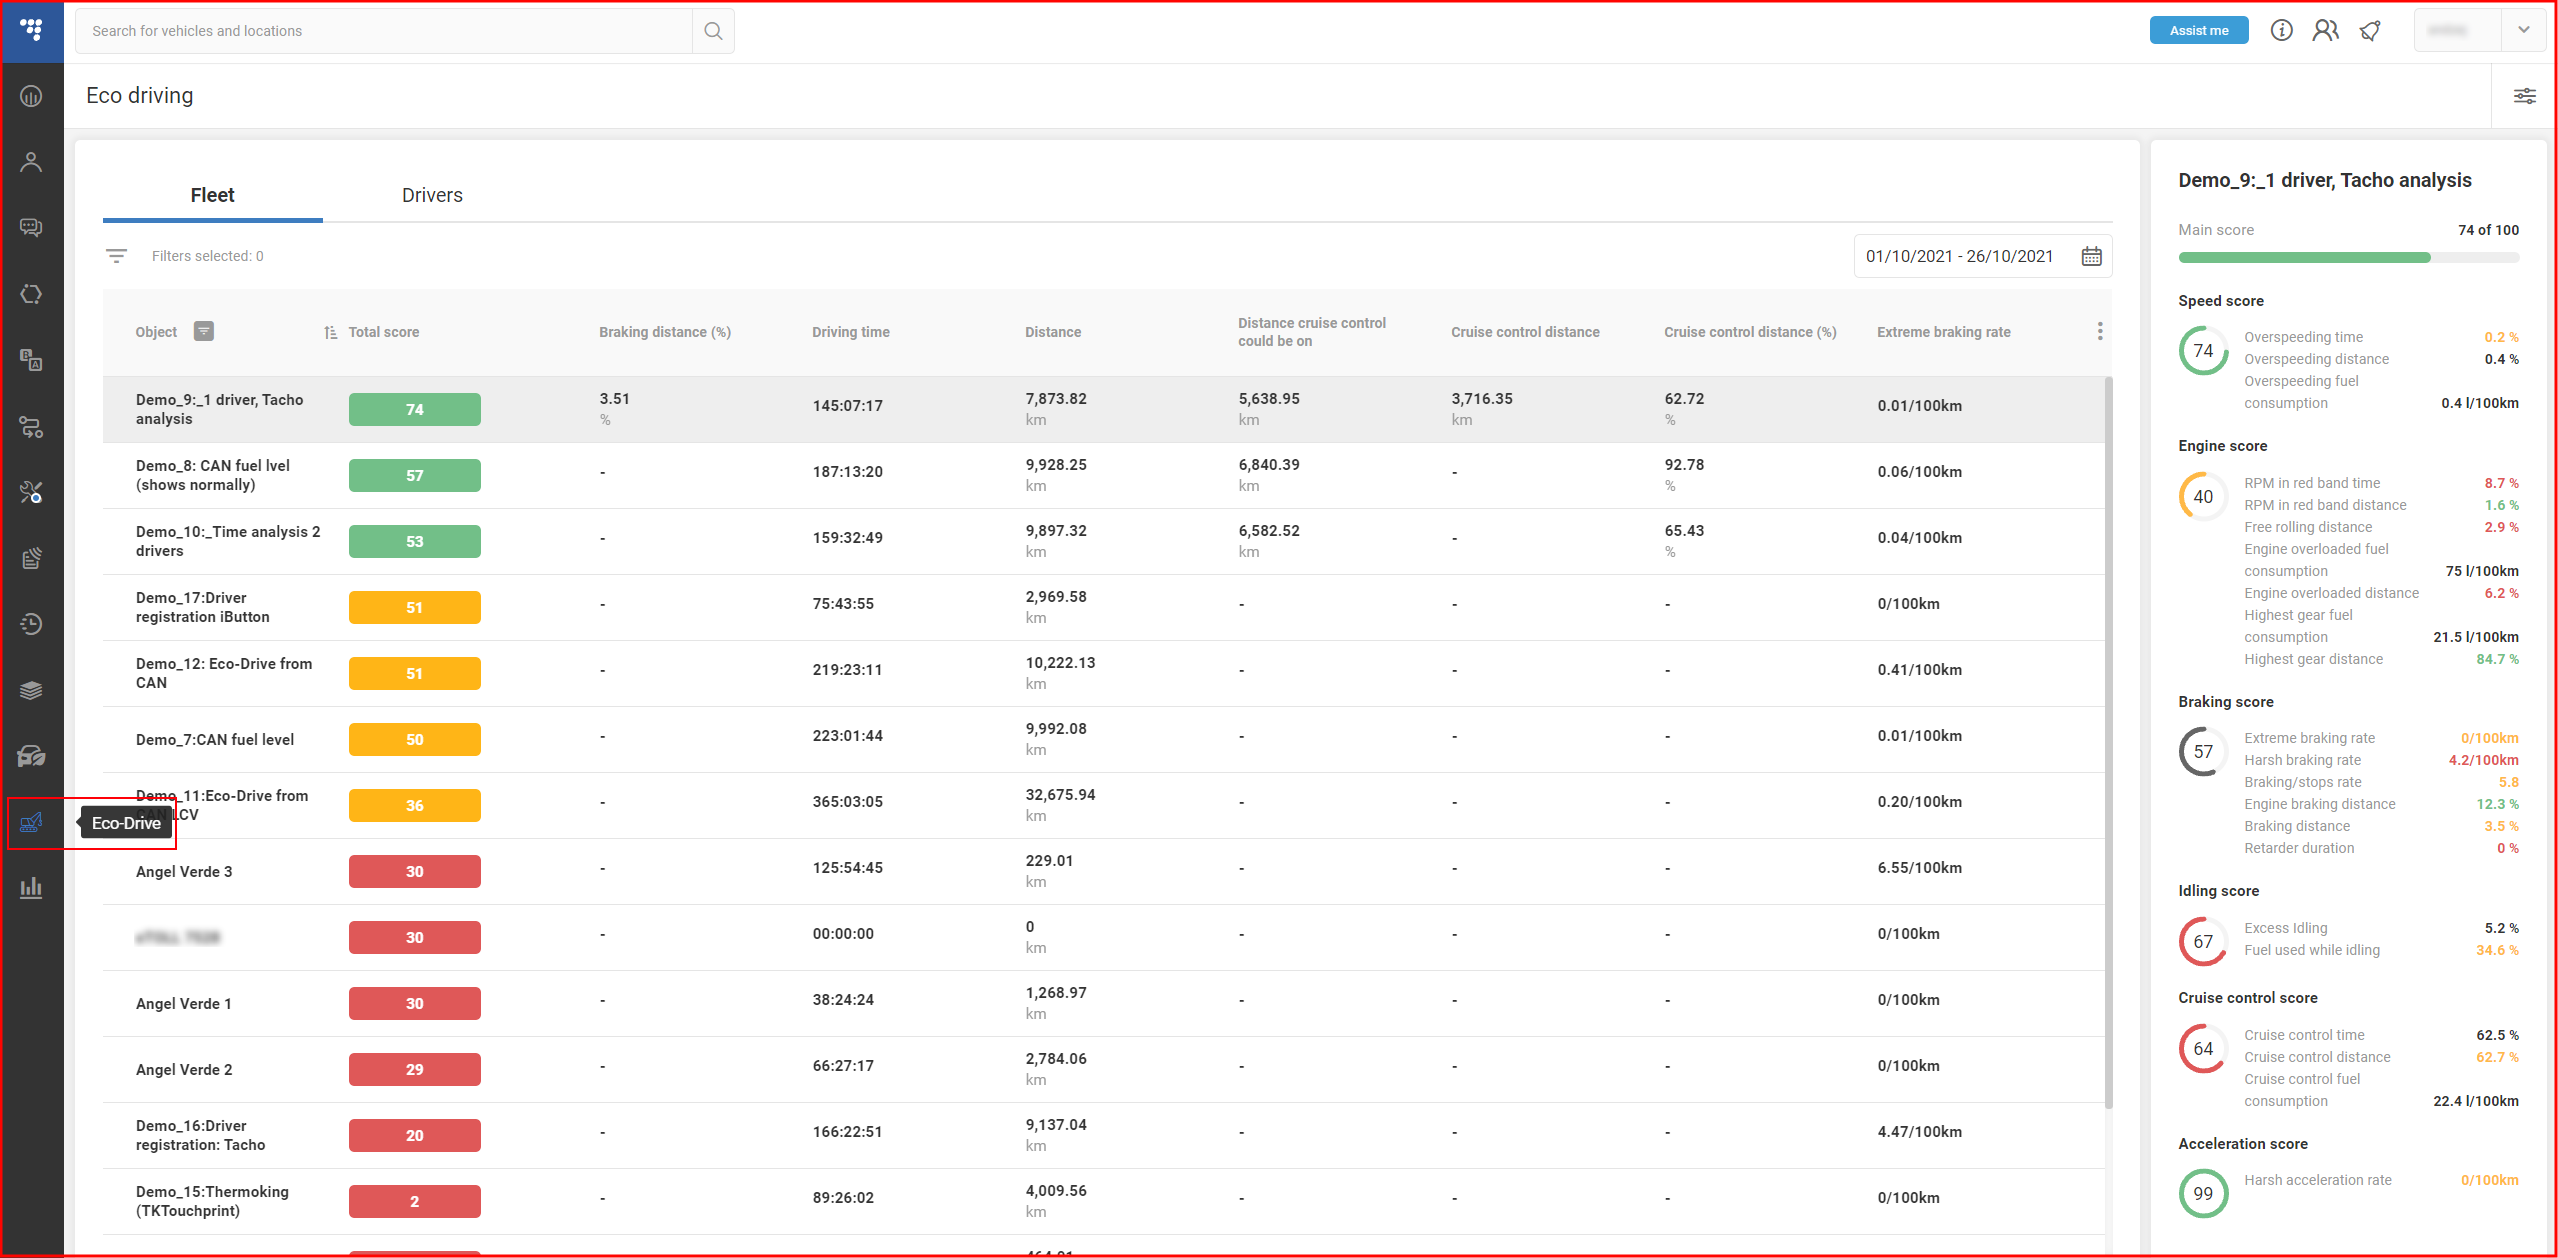
The menu consists of two main modules: an analysis of objects on the left and a score inspector on the right side of the page.
Analysis by driver/vehicle
This section displays a list of objects with their Eco-drive score and general information about them. The tabs at the top allow you to select between 2 possible categories:
- Fleet – a list of vehicles in the fleet
- Drivers – a list of individual drivers
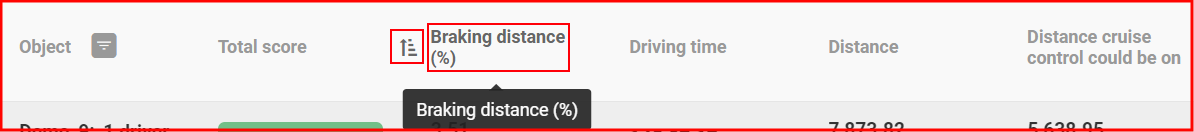
Both lists are identical and function in the same way. They consist of columns that can be sorted in ascending/descending order by clicking on their name. An arrow icon will be displayed next to the column name to indicate the direction in which the column is sorted.
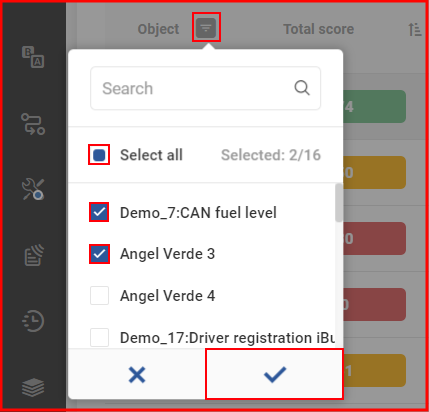
The Object/Driver column can also be filtered by clicking on the icon next to it. Tick the checkbox next to the objects you want to display and apply the filter by clicking the ✓ icon below.
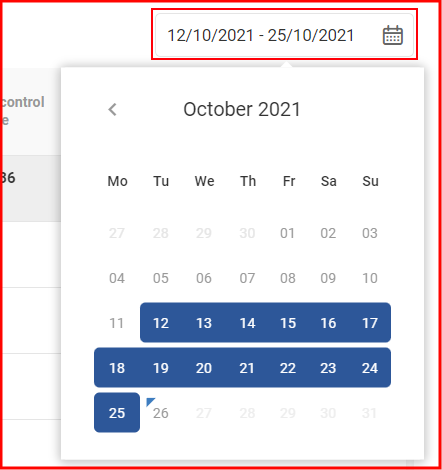
A time period for which the information is displayed can be selected at the top-right corner. Click on the box to open a calendar and select a starting date and an ending date. The current day is highlighted by a small blue triangle on the top left side of that day.
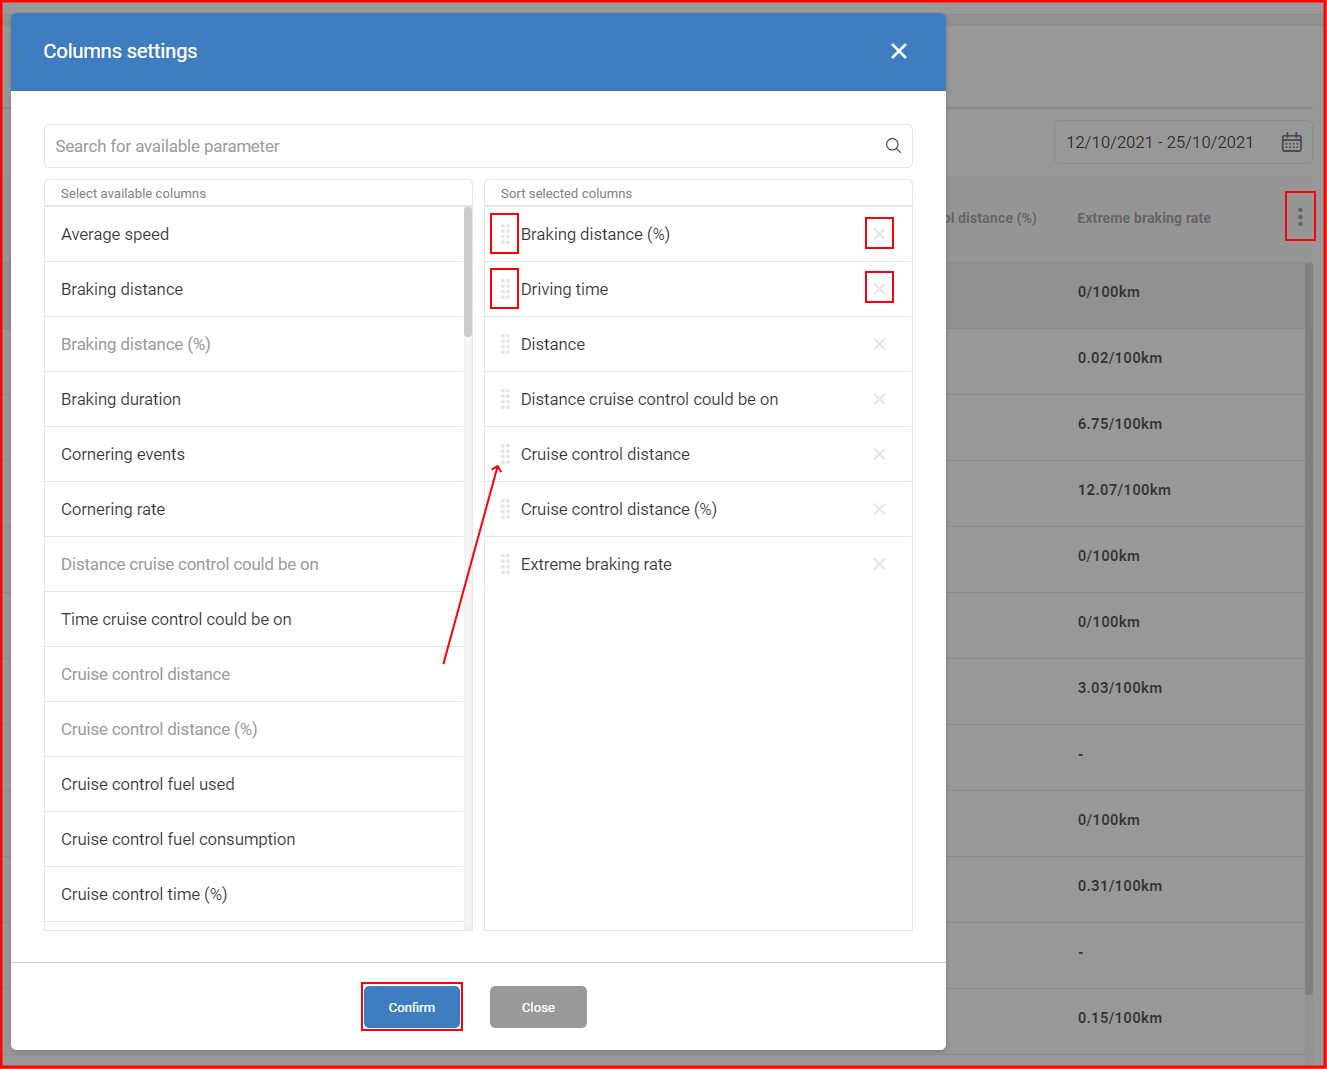
Columns can be configured by clicking on the three-dot icon on the top-right side of the list. This will bring up a column settings window where you can choose parameters to be displayed and change the order they appear in. Select columns by clicking them in the list on the left. Once an element is added, it will appear on the list on the right. Here they can be re-ordered by dragging up or down and deleted by clicking the X icon. Up to 8 columns can be added. To apply changes, click Confirm.
The following information can be displayed on the list:
- Object/Driver – the name of the vehicle/driver
- Total score – the total score for the vehicle/driver based on a configured calculation formula
- Average speed – the average speed at which the vehicle/driver was moving
- Braking distance – the distance traveled while the braking pedal was pressed
- Braking distance (%) – the percentage of the distance traveled while the braking pedal was pressed
- Braking duration – the total time period at which the braking pedal was pressed while the vehicle was moving
- Cornering events – the number of cornering events that exceed a configured limit
- Cornering rate – the number of cornering events per 100 km
- Distance cruise control could be on – the total distance at which the cruise control could have been turned on, while the speed was above a configurable threshold for more than 60 seconds
- Time cruise control could be on – the total time during which the cruise control could have been turned on, while the speed was above a configurable threshold for more than 60 seconds
- Cruise control distance – the total distance at which the cruise control was turned on
- Cruise control distance (%) – the percentage of the distance cruise control was used when it could be used
- Cruise control fuel used – the total amount of fuel used while the cruise control was active
- Cruise control fuel consumption – the fuel consumption (liters per 100 km) while the cruise control was on
- Cruise control time (%) – the percentage of hours cruise control was used when it could be used
- Distance cruise control was on when it could be on – the total distance at which the cruise control was on when it could have been turned on, while the speed was above a configurable threshold for more than 60 seconds
- Time cruise control was on when it could be on – the total time at which the cruise control was on when it could have been turned on, while the speed was above a configurable threshold for more than 60 seconds
- Distance – the total distance traveled
- Driving time – the duration of how long the engine was turned on
- Engine braking distance – the total distance spent braking. This is determined by three parameters: Speed and RPM exceeding their configured thresholds, and the fuel rate being below its configured threshold.
- Engine braking distance (%) – the percentage of the distance spent braking. This is determined by three parameters: Speed and RPM exceeding their configured thresholds, and the fuel rate being below its configured threshold.
- Engine overloaded distance – the total distance while the engine percent load was above a configured threshold
- Engine overloaded distance (%) – the percentage of the total distance while the engine percent load was above a configured threshold
- Engine overloaded fuel used – the amount of fuel used while the engine percent load was above a configured threshold
- Engine overloaded fuel consumption – the fuel consumption (liters per 100 km) while the engine percent load was above a configured threshold
- Excess idling (%) – the percentage of driving time while the vehicle was idling
- Extreme braking events – the number of extreme braking events. These are detected when the braking acceleration exceeds a configured limit.
- Extreme braking rate – the average amount of extreme braking events per 100 km
- Free rolling distance – the total distance during which the vehicle was free-rolling. This is detected when the engine is turned on, the accelerator pedal is not pressed, and RPM is in a configured range.
- Free rolling distance (%) – the percentage of the total distance during which the vehicle was free-rolling. This is detected when the engine is turned on, the accelerator pedal is not pressed, and RPM is in a configured range.
- Fuel consumed – the total amount of fuel consumed (liters)
- Fuel consumption – the total fuel consumed per 100 km
- Fuel used while idling (%) – the percentage of the fuel that was used while idling (when the engine is turned on for a configured duration and the vehicle’s speed is lower than the configured threshold).
- Harsh acceleration events – the number of harsh acceleration events. These are detected when the braking acceleration exceeds a configured limit.
- Harsh acceleration rate – the average amount of harsh acceleration events per 100 km
- Harsh braking events – the number of harsh braking events. These are detected when the braking acceleration exceeds a configured limit.
- Harsh braking rate – the average amount of harsh braking events per 100 km
- Highest gear distance – the total distance when the vehicle’s speed exceeds the configured highest gear speed parameter
- Highest gear distance (%) – the percentage of distance when the vehicle’s speed exceeds the configured highest gear speed parameter
- Highest gear fuel used – fuel used while the vehicle’s speed exceeds the configured highest gear speed parameter
- Highest gear fuel consumption – fuel consumption (liters per 100 km) while the vehicle’s speed exceeds the configured highest gear speed parameter
- Idling – the amount of idling time (when the engine is turned on for a certain duration (configurable) and the vehicle’s speed is lower than the threshold (configurable))
- Fuel used while idling – the amount of fuel that was used while idling (when the engine is turned on for a certain duration (configurable) and the vehicle’s speed is lower than the threshold (configurable))
- Maximum acceleration value – the maximum acceleration value reached
- Maximum braking value – the maximum braking value reached
- Maximum cornering value – the maximum cornering value reached
- Maximum speed – the maximum speed value reached
- Normal braking events – the number of normal braking events
- Normal braking rate – the average amount of braking events per 100 km
- Braking/stops rate – the amount of braking events/stops per 100 km
- Normal speed distance – the total distance when the vehicle’s speed was below the configured speed limit
- Overspeeding distance – the total distance when the vehicle’s speed was above the configured speed limit
- Overspeeding distance (%) – the percentage of the total distance when the vehicle’s speed was above the configured speed limit
- Overspeeding time – the total driving time when the vehicle’s speed was above the configured speed limit
- Overspeeding fuel used – the amount of fuel used when the vehicle’s speed was above the configured speed limit
- Overspeeding fuel consumption – the fuel consumption (liters per 100 km) when the vehicle’s speed was above the configured speed limit
- Overspeeding time (%) – the percentage of the total driving time when the vehicle’s speed was above the configured speed limit
- Retarder duration – the time period when the retarder torque mode was not at 0.
- Retarder duration (%) – the percentage of time when the retarder torque mode was not at 0.
- RPM in green band distance – the total distance when the RPM value was in the acceptable range (configurable)
- RPM in red band distance – the total distance when the RPM value was out of the acceptable range (configurable)
- RPM in red band distance (%) – the percentage of the total distance when the RPM value was out of the acceptable range (configurable)
- RPM in red band time – the amount of time when the RPM value was out of the acceptable range (configurable)
- RPM in red band time (%) – the percentage of the amount of time when the RPM value was out of the acceptable range (configurable)
- Maximum RPM– the maximum RPM value reached
- RPM range 1-4 distance – the total distance while the vehicle’s engine was running in a configured RPM range (up to 4 different ranges)
- RPM range 1-4 fuel used – the amount of fuel used while the vehicle’s engine was running in a configured RPM range (up to 4 different ranges)
- Stops – the number of times the vehicle stopped
- Stops rate – the number of times the vehicle stopped per 100 km
Score inspector
By clicking on an object in the list, a score inspector window will appear on the right side of the screen. Here you can see the overall score for the following categories:
- Total score – the sum of all of the scores listed below
- Speed score – the score based on Overspeeding time, Overspeeding distance, and Overspeeding fuel consumption parameters
- Engine score – the score based on RPM in red band time, RPM in red band distance, Free rolling distance, Engine overloaded fuel consumption, Engine overloaded distance, Highest gear fuel consumption, and Highest gear distance parameters
- Braking score – the score based on Extreme braking rate, Harsh braking rate, Braking/stops rate, Engine braking distance, Braking distance, and Retarder duration parameters
- Idling score – the score based on Excess idling and Fuel used while idling parameters
- Cruise control score – the score based on Cruise control time, Cruise control distance, and Cruise control fuel consumption parameters
- Acceleration score – the score based on the Harsh acceleration rate parameter
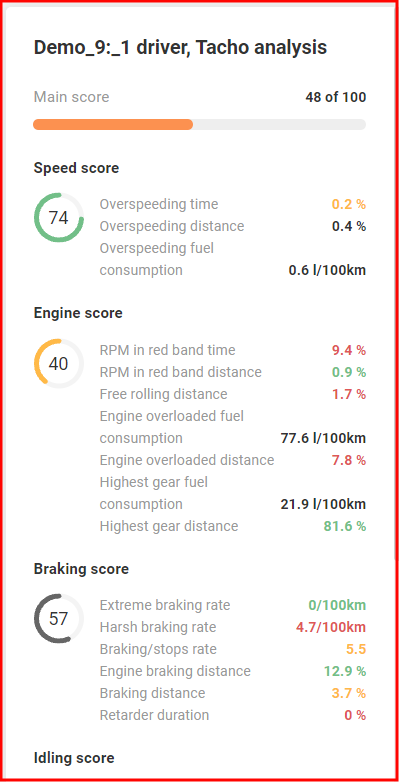
Each score is calculated based on the parameters that are assigned to it. The score is presented in a number from 0 to 100. The higher the number, the better the score is. The colors of the circles indicate whether the score is in a good (green), average (yellow), or bad (red) range. If there is not enough data to calculate the score (score is at 0), it will be displayed in a gray color circle. Scores that are not counted in the total score are displayed in black. If the parameter is not received from the device it will be displayed as “-“.
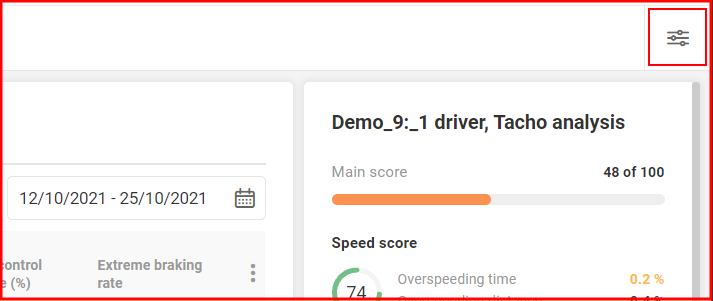
The values and logic of how the scores are calculated and their color indication can be configured manually by clicking on the icon in the top-right corner of the Eco-Drive page. This will open a new Configure scores window.
Configure scores
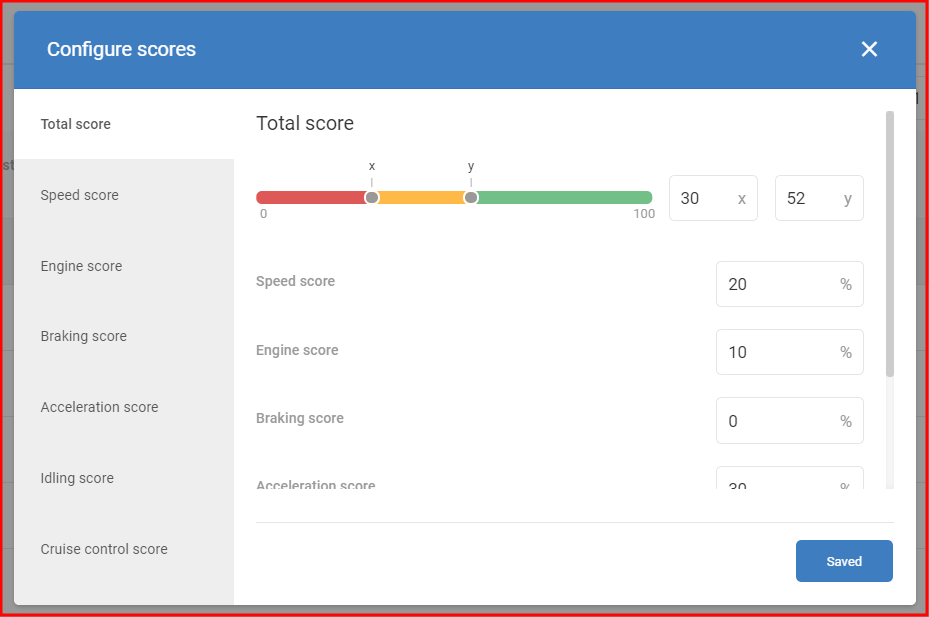
In this window, it is possible to configure how various scores are calculated. Each score has its own parameters and thresholds that are used in the calculation logic.
Note
Changes made are saved automatically.
Total score
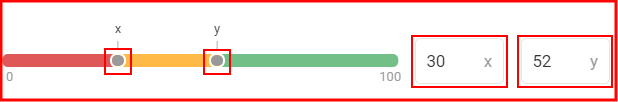
The slider bar can be set to display a value in a certain color if it is in its range. Here, the values below x will be displayed in red and the values above y will be displayed in green. Values between x and y will be displayed as yellow. These can be changed by dragging the x and y sliders or typing the values manually in the input bars on the right.
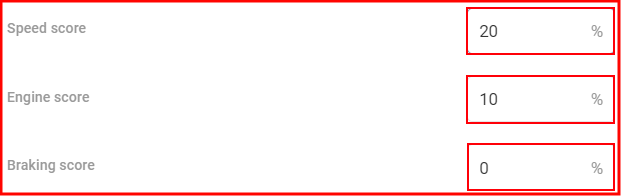
The total score is calculated as the sum of all other scores. How much an individual score impacts the total score can be changed by setting a different coefficient value (%). Parameters that provide no data should always be set at 0%.
Note
The sum of all coefficients must be 100%.
Other scores
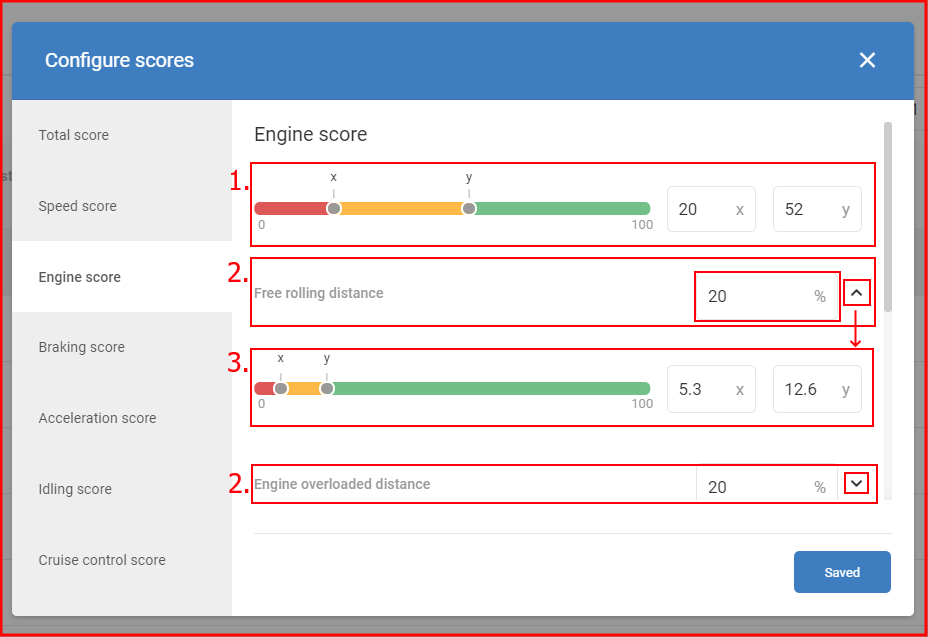
Each score tab consists of the following:
- Color slider (1) – the slider bar at the top of each score tab can be configured to set the value range for color representation (see above)
- Parameter names and coefficients (2) – the list of parameter names that are used in the calculation of the score. The input bar next to each parameter indicates the coefficient of how much weight the parameter has in the final score calculation.
- Parameter threshold value slider (3) – clicking the arrow next to the coefficient input will display the slider for that parameter. Here you can set the x and y threshold values. If the parameter value is in the positive (green) area, it will be added as 100 to the final score calculation. If it is in the negative (red) area it will have a value of 0. Any score in the yellow range will return a percentage between the green and red thresholds.
For example, if the Overspeeding time (%) parameter has the x threshold set to 10 and the y threshold is set to 50 and the parameter value is 5, it is lower than the x threshold (green area), therefore the Overspeeding time used in the Speed score calculation will be 100. Multiplied by the set coefficient (ex.: 50%), then 100 * 0.5 = 50.
The final value of each score is displayed in the Score inspector.
Note
The sum of all coefficients must be 100%.
Note
Not all sliders are the same in their color order. Some parameters may have a lower value displayed in a positive green color, while the higher value is a negative red. This is common for parameters where having a lower value is better.