The fuel TAB displays fuel information for the selected vehicle. This information includes the following:
- Date period;
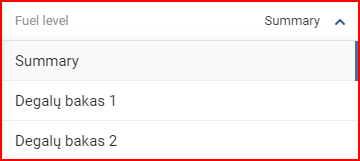
- Fuel level source selector – will be displayed only if more than one fuel level data source is available;
- Fuel level graph;
- Refuel and drain summary;
- Detailed overview of all drains and refills;
- Map with details.
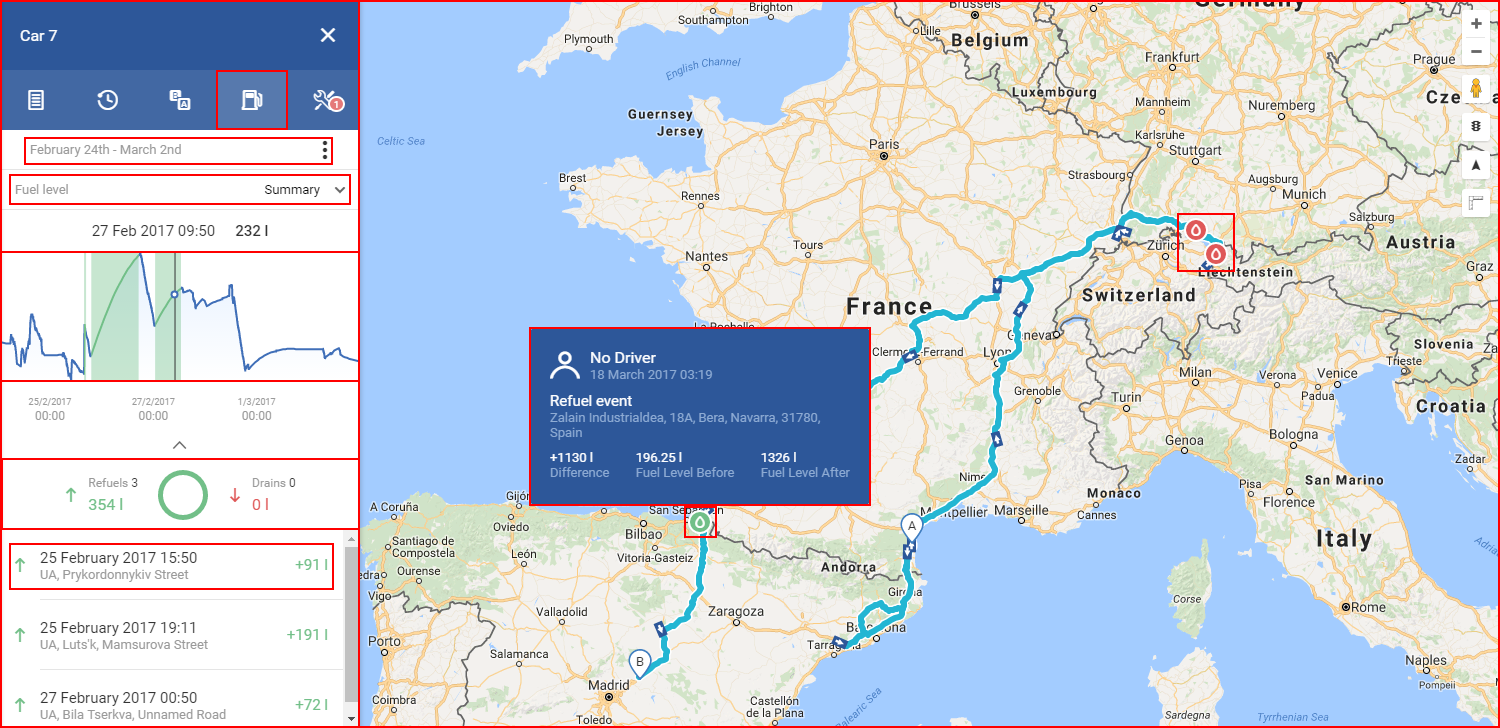
Date – defines the time period for which to display the fuel report. By default the last full 7 days are selected. This can be changed by clicking the three dots at the right side of the displayed date. The date selection method is the same as described in previous sections. The maximum length of the time period is 1 month.
Fuel level source selector – this selector allows choosing various sources (if configured) for fuel information. For example, several fuel level sensors are installed and configured on a vehicle, then the user can select data from which one to display. The fuel sensor names can be customized, contact your service provider for more information. By default, this selector is set to “Summary” which means it shows the average value from all available sources. This selector is shown only if more than one data source for the fuel level is available.
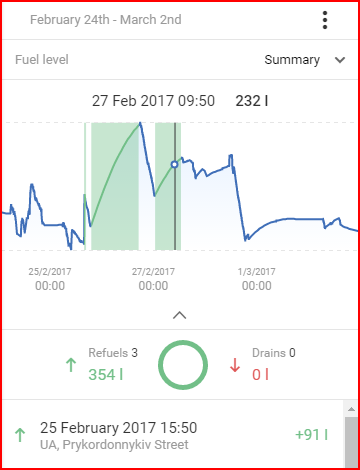
Graph – Displays the fuel levels during the selected time period. The graph scale is auto formatted by the selected time period. Refuel events are marked in green, while drain event are marked in red. Moving the mouse pointer over the graph will display additional information above the graph for the specific point over which the mouse pointer is located. The date, time and fuel level for that specific time point will be displayed. The graph can be hidden/unhidden by clicking the arrow icon, located under the graph.
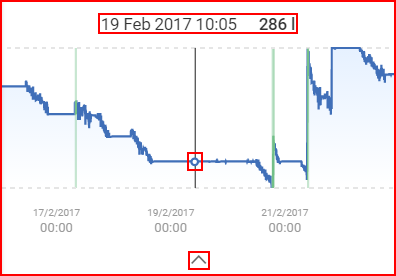
The computer mouse can be used to navigate through the graph. Using the mouse wheel the user can either zoom in or zoom out of the graph. When zoomed, the user can move the graph from side to side by click and dragging the graph with left mouse button. Clicking on the marked green/red area in the graph will navigate the map to the selected event.
Refuel and drain summary – displays the total amount of fuel refueled/drained and the number of refuel/drain events over the selected time period.
Detailed overview of all drains and refuels – Displays all drain/refuel events in a chronological order. Every event is either marked as Refuel (and has a green arrow facing up next to it) or Drain (and has a red arrow facing down next to it). Every event is marked with an exact date and time of the event. By clicking on a Drain/Refuel from the list, the map will automatically navigate to the exact position where this event has occurred and will also auto update the graph to the time period when this event has happened.
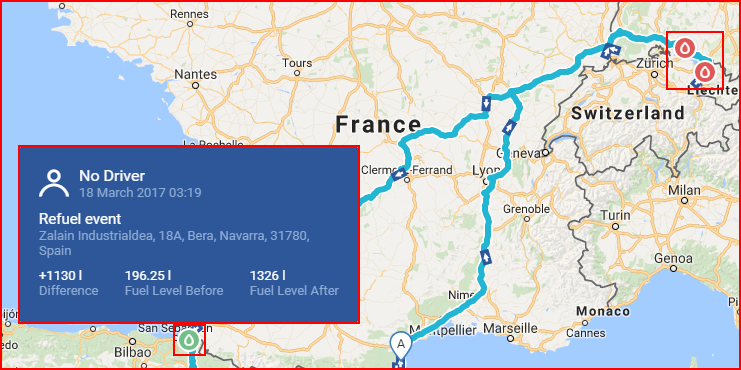
Map with details – the map will display the trip for time period selected for the fuel overview. Along with the trip, drain and refuel events will be displayed on the map. The user can click an icon for additional information.