Obecnie dostępny jest wybór dwóch źródeł map. Może to być mapa świata OSM (opcja domyślna) lub mapa świata Google. Można je łatwo przełączać – wystarczy kliknąć na nałożone na siebie mapy w prawej dolnej części mapy. Aktualnie wyświetlana mapa będzie widoczna na górze. Użytkownik może wybrać jeden z czterech rodzajów mapy:
- OSM – mapa OpenStreetMap;
- Widok satelitarny – wyświetla satelitarny obraz map Google bez oznaczenia ulic;
- Widok hybrydowy – wyświetla satelitarny obraz map Google z dodanymi oznaczeniami ulic;
- Widok ulic – wyświetla ulice według map Google bez obrazu satelitarnego.
| Icon | Description |
|---|---|
| Buttons to "zoom in" or "zoom out" of the map. | |
| Google „Street View“. (Works on all maps, except OSM). To use Google Street View, click and hold this icon and then frag the icon to the street you want to observe. To exit Google Street View, the user must click the grey arrow located at the top right side of the screen. | |
| Traffic information. To activate this function, simply click the icon (This function works only on the Hybrid or the Street map). This function display traffic intensity (in places where this information is available) by displaying colored lines on the map. Green and similar colors indicate low traffic intensity, while Red and darker colors indicate high traffic intensity. | |
| Routing & Tasks. Clicking this icon will open the routing & tasks menu on the left side of the screen. Routing & Tasks menu is described in a separate section. | |
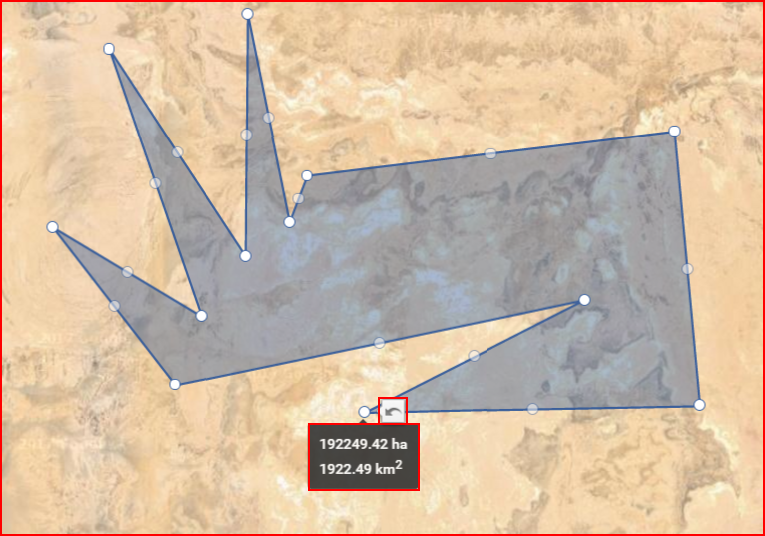
| Measure area. Clicking this icon activates the measuring tool. While it is activated, the user can mark a territory on the map (similar to how geozones are marked), by connecting several dots. Once the dots are connected, the covered territory is highlighted and additional perimeter dots appear. The user can move these dots (click & drag) to change the measuring area (After moving a dot, a "Undo" button appears, clicking which allows to return the dot to the previous position). Moving the mouse over the highlighted area will display its size. An example is shown below. | |
| Geozones. Clicking this icon will expand the right side of the screen, where a list of all existing geozones for the current user is located. An example with a description is provided further below. |
Jak wspomnieliśmy w tabeli powyżej, po kliknięciu na przycisk geostref pojawi się pasek boczny, co pokazuje poniższa ilustracja.
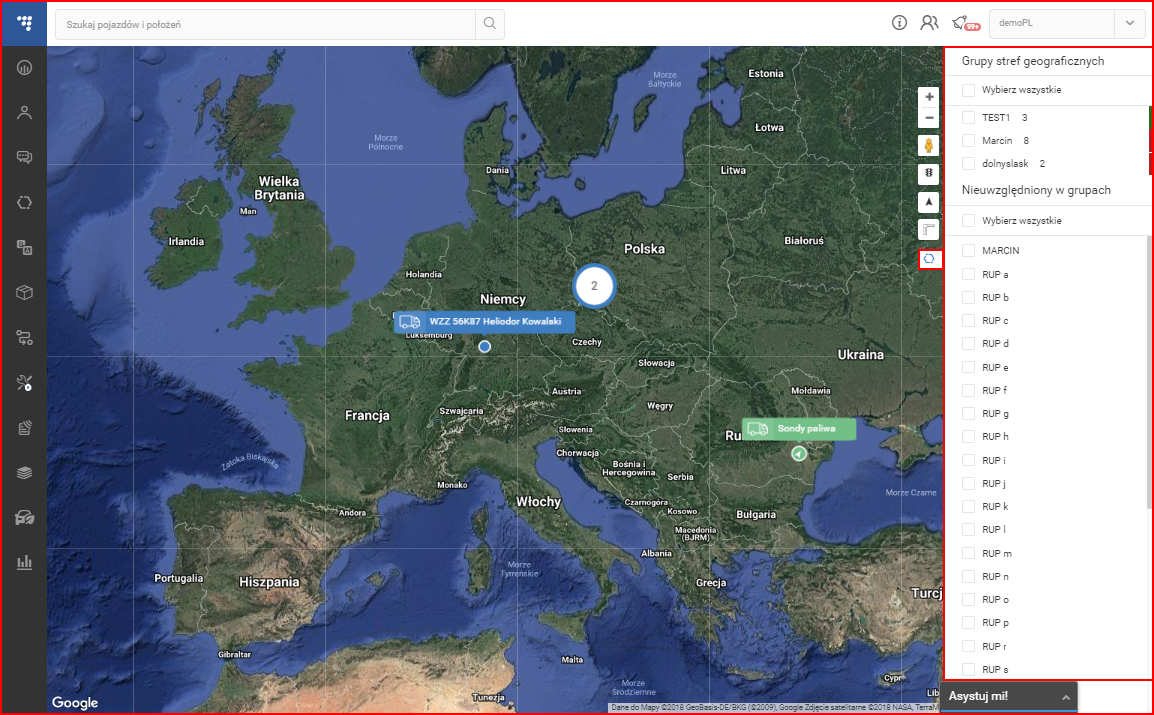
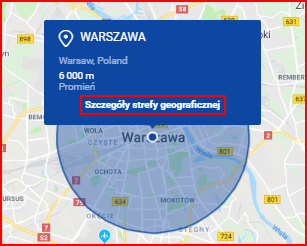
Tutaj użytkownik może ustawić wyświetlanie lub ukrywanie dostępnych geostref na mapie. Po wybraniu, geostrefy będą wyświetlane na mapie, niezależnie od tego, czy panel geostref jest otwarty. Geostrefy są oznaczone niebieskimi znacznikami. Te w kształcie balonu to punkty POI, natomiast sześciokąty to obszary.
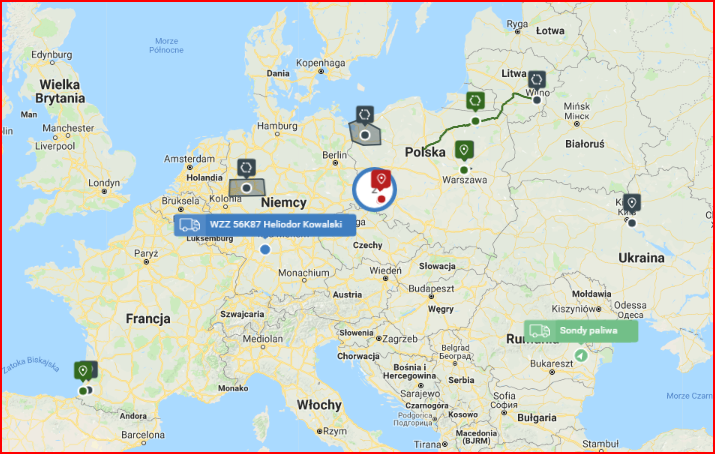
Gdy użytkownik wybiera geostrefy na panelu bocznym, mapa automatycznie ustawi powiększenie tak, aby zmieścić wszystkie wybrane geostrefy na ekranie. Po kliknięciu na znacznik geostrefy pojawią informacje na jej temat.