Eco-Drive report – this report type is focused on the Eco-Drive functionality and its parameters. The first thing the user must select is the date range, for which this report will be generated.
Date range – to select a date the user must click the “Date range” field which will open the calendar panel. To select a begin/end date the user must simply click the desired date and then click the opposite date. The selected days will be highlighted in blue. The current day is highlighted by a small blue triangle on the top left side of that day. If the current day is selected (highlighted), the triangle will be inverted to white. Afterwards the user can specify from what time of the begin date until what time of the end date to display the data. The time can be changed incrementally by one hour by using the arrow buttons. To apply the changes the Apply button must be clicked, otherwise the changes will not be saved.
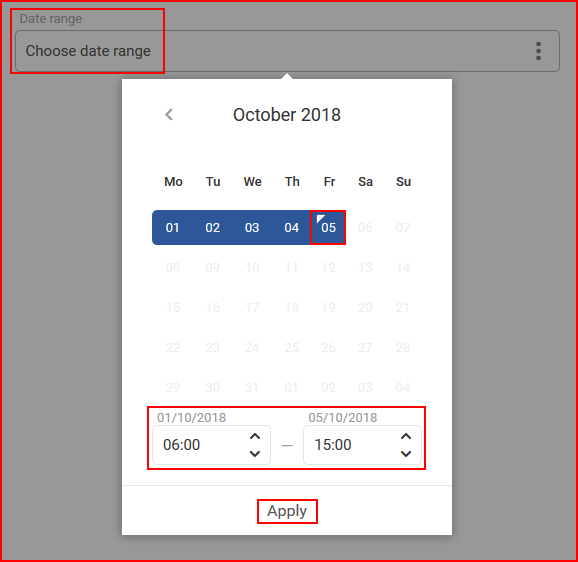
The minimal date period is one day. To select one day simply double click the left mouse button on the desired day to select it.
The maximal date period is three months (90 days). You cannot select a longer period.
Report based on – this setting defines the main target of the report. There are two available options:
- Drivers
- Objects
What exactly this does is, that the generated report will display information (parameters: trip distance, work begin location, etc.) for the selected target (Drivers or Objects). So if Objects are selected, then the report will display information for specifically selected objects.
Objects/Drivers – (Depends on the selection in the “Report based on” option) this allows the user to choose for which objects/drivers the report will be generated.
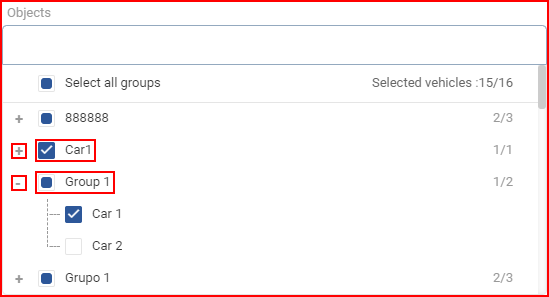
If Objects are selected, the list will also contain groups of objects. The user can select a whole group by marking the checkbox before the group or click the + button to expand the group and see which objects are in the group. To collapse the group, the user must click the – button. Individual objects can be selected from a group. It is important to note, if an object that is present in several groups is selected, it will be highlighted in every group as shown below in the picture. If a whole group is selected, the checkbox will be blue with a white tick. If only a part of the group is selected, the group will have a blue square in the checkbox. (shown in the picture below). The user can also use the search, to quickly go through a large list of objects and groups. All groups can be selected/unselected by ticking the checkbox next to “Select all groups”. The number of selected objects and total objects is displayed at the upper right corner of the list.
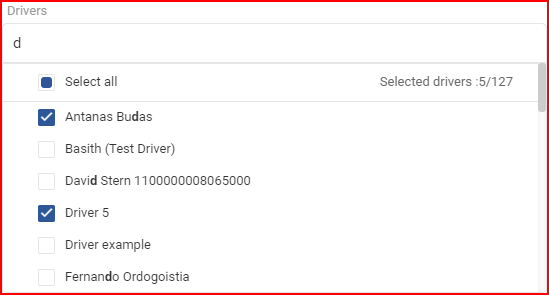
If Drivers is selected, drivers will be displayed in the drop-down list. To select a driver, the user has to mark the checkbox next to the driver. Marking the checkbox next to “Select all” will select/deselect all drivers. The list is automatically updated with each symbol typed in the search bar. The number of selected drivers and total drivers is displayed at the upper right corner of the list.
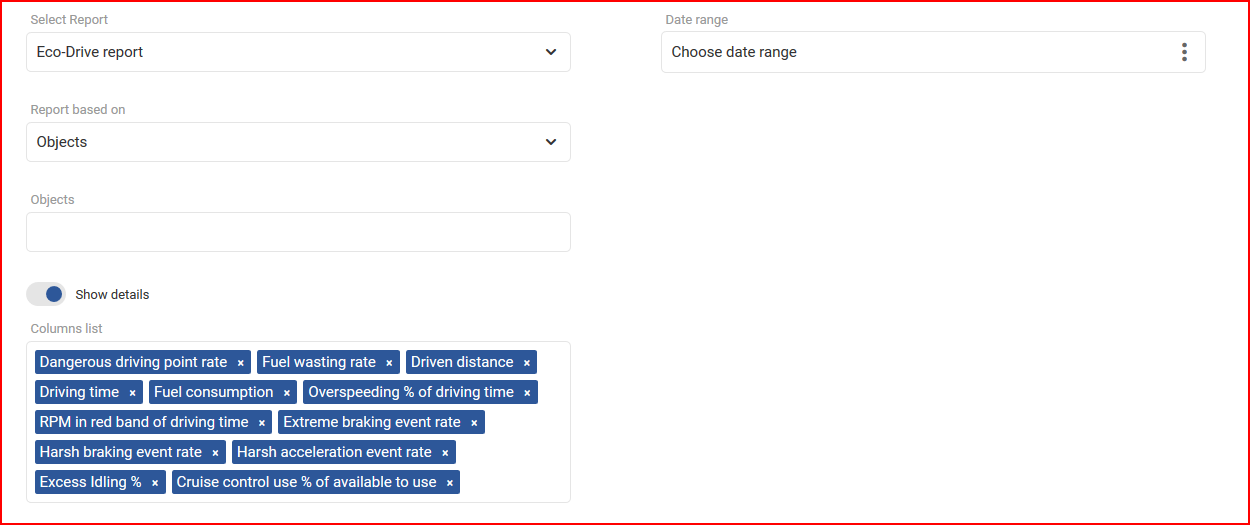
Next, the user must configure the column list. This report will include the following parameters selected by default:
- Dangerous driving point rate
- Fuel wasting rate
- Driven distance
- Driving time
- Fuel consumption
- Overspeeding % of driving time
- RPM in red band of driving time
- Extreme braking event rate
- Harsh braking event rate
- Harsh acceleration event rate
- Excess idling %
- Cruise control use % of available to use
Other optional parameters that can be selected in the column list:
- Average speed
- Dangerous driving points
- Extreme braking events
- Fuel consumed
- Fuel wasted
- Harsh acceleration events
- Harsh braking events
- Idling duration
- Maximum RPM rev/minute
- Maximum speed
- Normal braking event rate
- Normal braking events
- Overspeeding duration
- Wasted fuel % of fuel consumed
After selecting the parameters, the user can enable or disable the following options:
- Show details – enabled by default, this option will include data for each vehicle in separate tables, including data for each driver who had driven the vehicle during the selected time period.
To finalize and generate the report, the user must click the Generate button. To cancel the creation of a report the user must click the Cancel button.