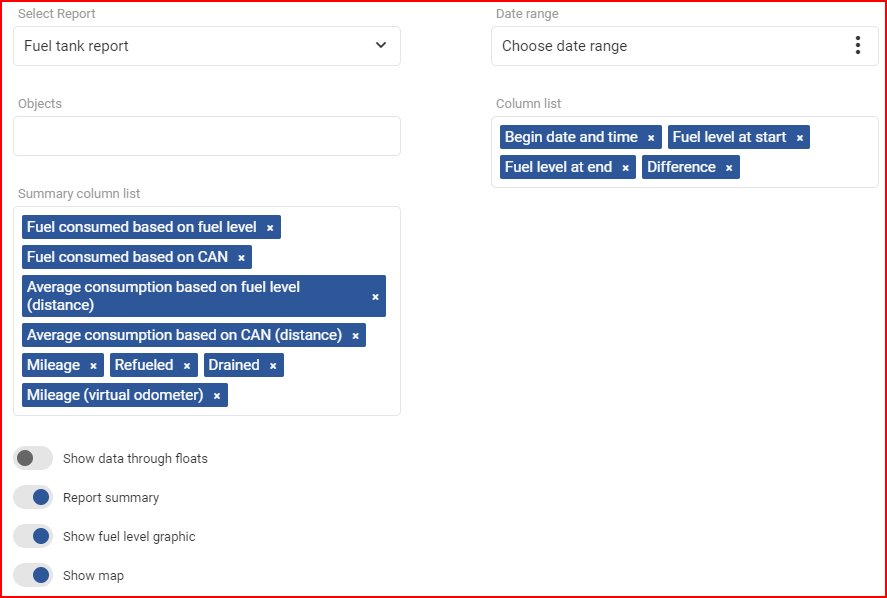
Fuel tank report – this report type is focused mainly on fuel consumption, refuels, drains and various fluctuations. The first thing the user must select is the date range, for which this report will be generated.
Date range – to select a date the user must click the “Choose date range” which will open the calendar panel. The calendar panel is identical in all of the FMS. To select a begin/end date the user must simply click the desired date and then click the opposite date. The selected days will be highlighted in blue. The current day is highlighted by a small blue triangle on the top left side of that day. If the current day is selected (highlighted), the triangle will be inverted to white. Afterwards the user can specify from which hour of the begin date until which hour of the end date to display the history. To apply the changes the “Apply” button must be clicked, otherwise the changes will not be saved.
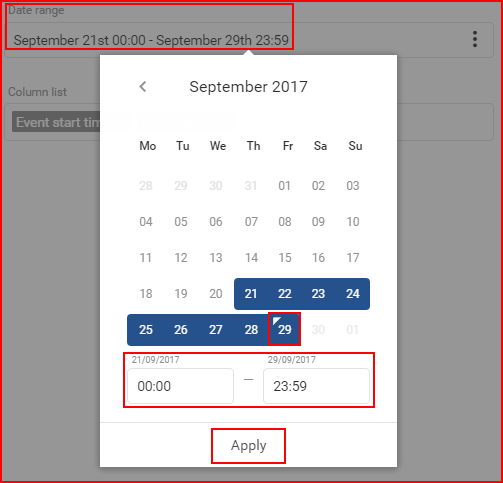
The minimal date period is one day. To select one day simply double click the left mouse button on the desired day to select it. Afterwards the user must select the objects for which this report will be generated on.
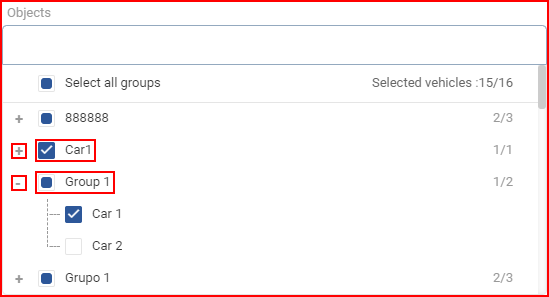
Objects – this allows the user to choose for which objects the report will be generated. The list will also contain groups of objects. The user can select a whole group by marking the checkbox before the group, or click the “+” button to expand the group and see which objects are in the group. To collapse the group, the user must click the “-” button. Individual objects can be selected from a group. It is important to note, if an object that is present in several groups is selected, it will be highlighted in every group as shown below in the picture. If a whole group is selected, the checkbox will be blue with a white tick. If only a part of the group is selected, the group will have a blue square in the checkbox. (shown in the picture below). The user can also use the search, to quickly go through large list of objects and groups. All groups can be selected/deselected by ticking the checkbox next to “Select all groups”. The number of selected objects and total objects is displayed at the upper right corner of the list.
Columns in summary – this filed allows to select which columns will be included in the reports summary (report summary is enabled by default for this report type). Maximum of 9 columns can be selected for one report. The selection consists of 28 possible columns, which are self-explanatory by their names.
After the columns in summary are selected, the user must select the column list. This report will include the following parameters by default (and can be deselected):
- Begin date and time – date and time when a change in the fuel level was registered;
- Fuel level at start – fuel level at the beginning of a registered change in the fuel level;
- Fuel level at end – fuel level at the end of a registered change in the fuel level;
- Difference – difference in the fuel level of the beginning value and end value.
Other optional parameters that can be selected in the column list:
- Driver – driver name;
- End date and time – date and time when fuel change event was registered;
- Location at event start – location where the fuel change event began.
After selecting the parameters in the columns, the user can enable disable, the following content in the report:
- Show data through floats – disabled by default, will display information in the report separately for each installed fuel level sensor (if several fuel level sensors are installed).
- Report summary – enabled, by default, this option will include a summary section in the report. This will summarize all information in the report and include the previously selected columns in summary.
- Show fuel level graphic – enabled by default, this option will include a fuel level graphic in the generated report.
- Show map – enabled by default, this option will include a map in the report, with all drain/refuel events marked on it.
To finalize and generate the report, the user must click the “Generate” button. To cancel the creation of a report the user must either click the “Cancel” button or click anywhere outside the “Generate new report” window.