Currently a selection of two map sources is available. This can either be “OSM” (default option) map of the world, or Google world map. Switching between them is easy, simply click on the stacked maps on the lower right part of the map. The currently displayed map will be displayed on top. The user may choose out of four map types:
- OSM – Open street map;
- Satellite – Displays Google satellite image map without marking streets;
- Hybrid – Displays Google satellite image map with added street markings from street mapping;
- Street – Display Google street mapping without satellite imaging.
| Icon | Description |
|---|---|
| Buttons to "zoom in" or "zoom out" of the map. | |
| Google „Street View“. (Works on all maps, except OSM). To use Google Street View, click and hold this icon and then frag the icon to the street you want to observe. To exit Google Street View, the user must click the grey arrow located at the top right side of the screen. | |
| Traffic information. To activate this function, simply click the icon (This function works only on the Hybrid or the Street map). This function display traffic intensity (in places where this information is available) by displaying colored lines on the map. Green and similar colors indicate low traffic intensity, while Red and darker colors indicate high traffic intensity. | |
| Routing & Tasks. Clicking this icon will open the routing & tasks menu on the left side of the screen. Routing & Tasks menu is described in a separate section. | |
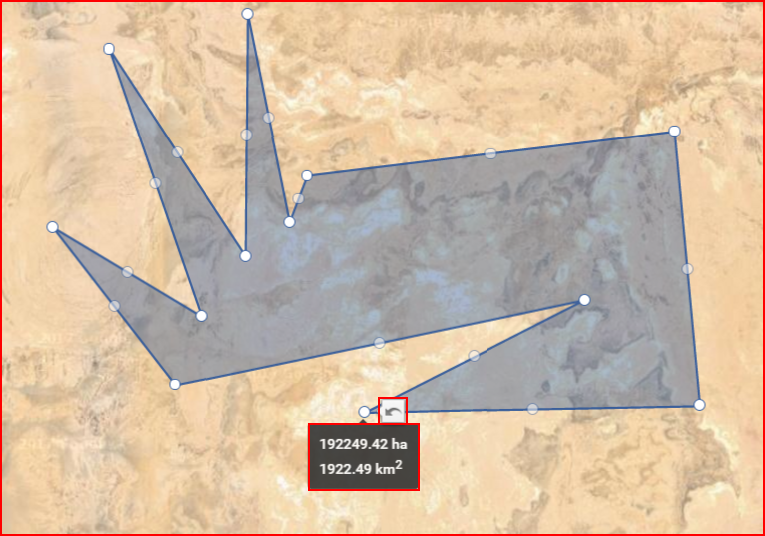
| Measure area. Clicking this icon activates the measuring tool. While it is activated, the user can mark a territory on the map (similar to how geozones are marked), by connecting several dots. Once the dots are connected, the covered territory is highlighted and additional perimeter dots appear. The user can move these dots (click & drag) to change the measuring area (After moving a dot, a "Undo" button appears, clicking which allows to return the dot to the previous position). Moving the mouse over the highlighted area will display its size. An example is shown below. | |
| Geozones. Clicking this icon will expand the right side of the screen, where a list of all existing geozones for the current user is located. An example with a description is provided further below. |
As mentioned in the previous table, clicking the “Geozones” button will open a side window as shown below.
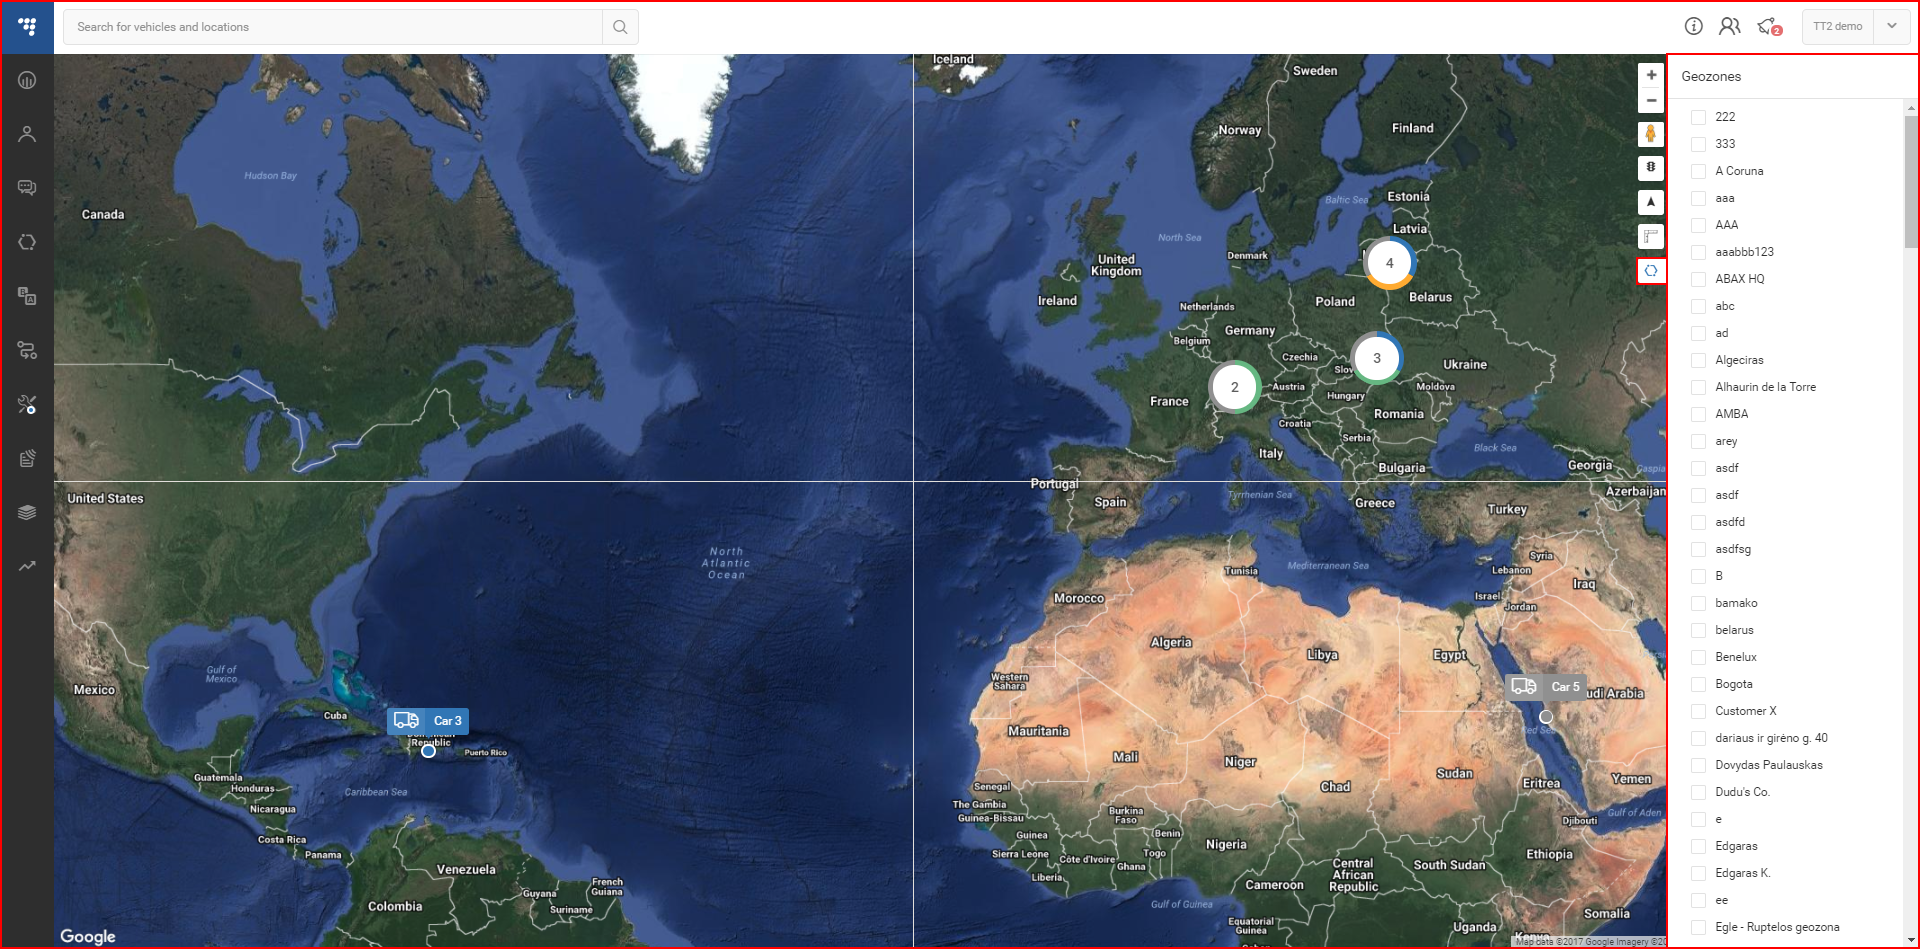
Here the user can select to show or hide any of the available Geozones on the map. Once selected, geozones will now be displayed on the map, regardless whether the geozones panel is open or not. Geozones are marked by blue markers, balloon shaped geozones are POI, while hexagons are polygonal geozones.
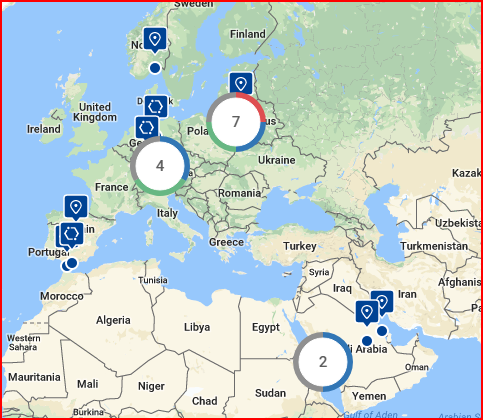
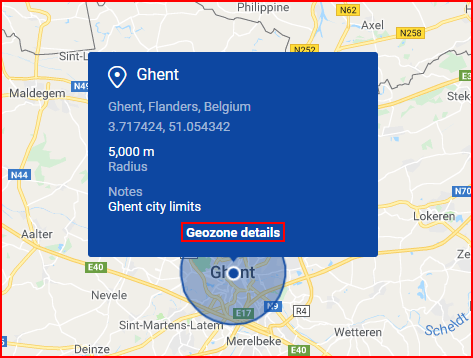
When the user is selecting a geozone from the side panel, the map will auto zoom, to fit all the selected geozones on the screen. Clicking a geozone marker will display a information tooltip about the geozone. The tooltip contains the following information:
- Name;
- Location;
- Coordinates – can be copied by clicking on them;
- Radius or area;
- Notes (if added).
Clicking on “Geozone details” will open the Geozones panel with detailed information about the geozone.
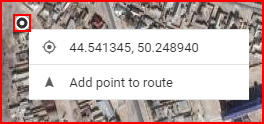
Right clicking on any point in the map will open a pop-up with the exact coordinates of that point. The user can copy the coordinates by clicking on them or add them to a route by clicking “Add point to route”.